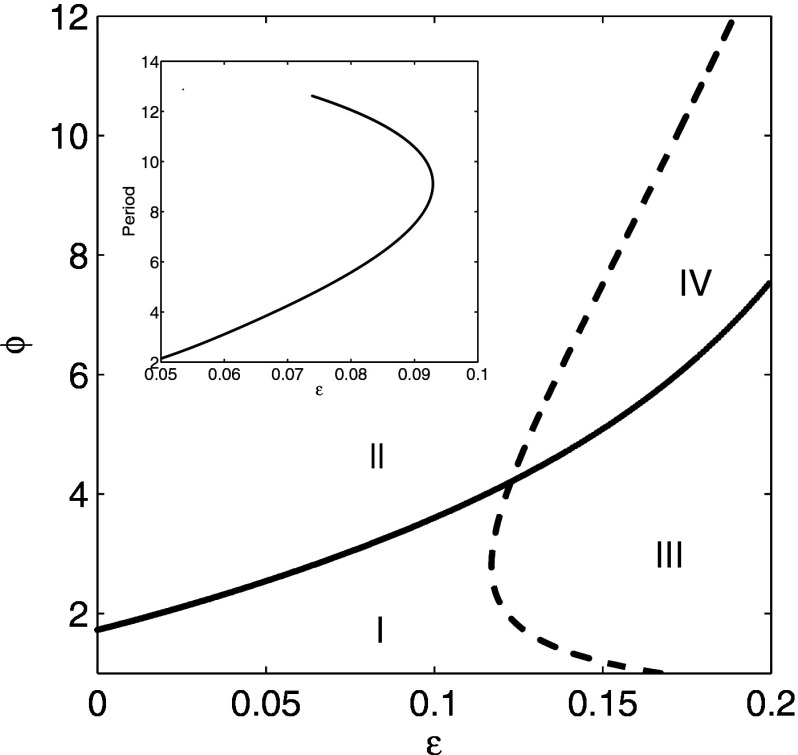
FIG. 10.
Blowup of bifurcation diagram in Fig. 9 for small cross immunity and ADE . Curves indicate location of Hopf bifurcations. Only region I has stable steady states. The inset shows the period of a branch of unstable orbits as a function of for in region II. See text for details.

