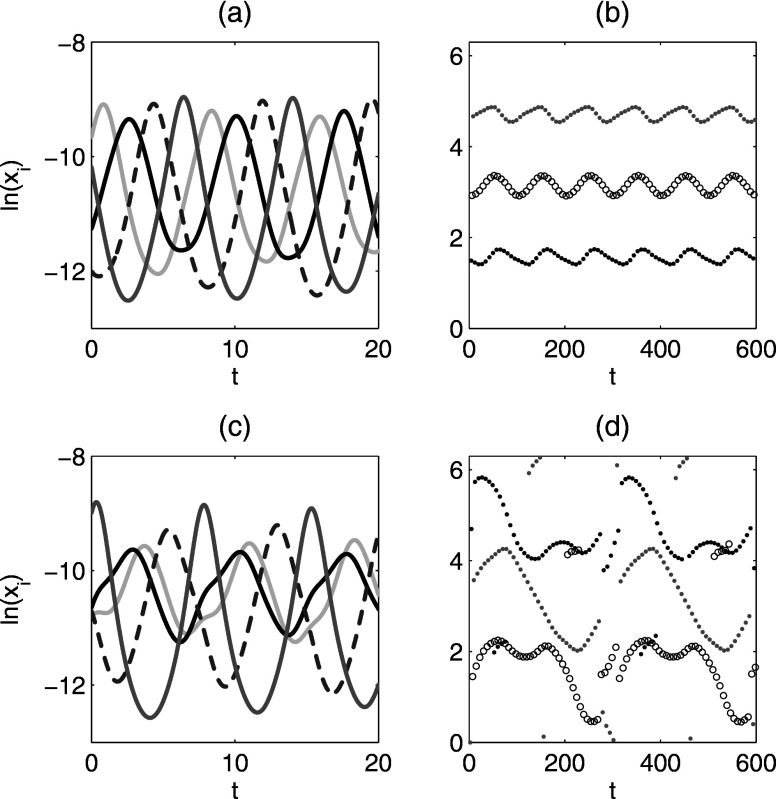
FIG. 6.
Quasiperiodic attractors for [panels (a) and (b)] and [panels (c) and (d)]. Time series of primary infectives (log variables) are shown in (a) and (c). Phase differences of primary infectives relative to primary infective are shown in (b) and (d). The time series in (a) and (c) are the beginning of those used to generate (b) and (d). The reference strain is the lightest gray curve in (a) and (c). Other parameters: .

