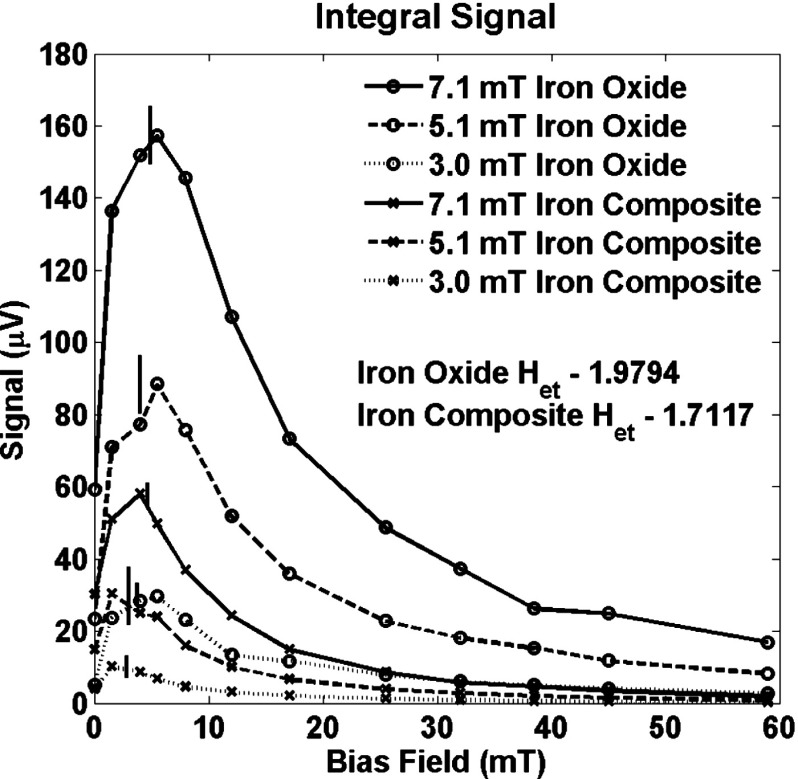
FIG. 6.
The total signal from all measured harmonics (2–9) for a sample of iron oxide nanoparticles and for a sample of iron core composite nanoparticles as functions of the bias field, . The total signal increases significantly with the addition of a bias field and it shows that the signal is difficult to saturate. The total signal can be estimated numerically from an estimate of obtained from the ratio of the signal at the 3rd and 5th harmonic frequencies. The predicted peaks are marked with longer vertical lines for the iron oxide nanoparticles, , and with shorter vertical lines for the iron core composite nanoparticles, .

