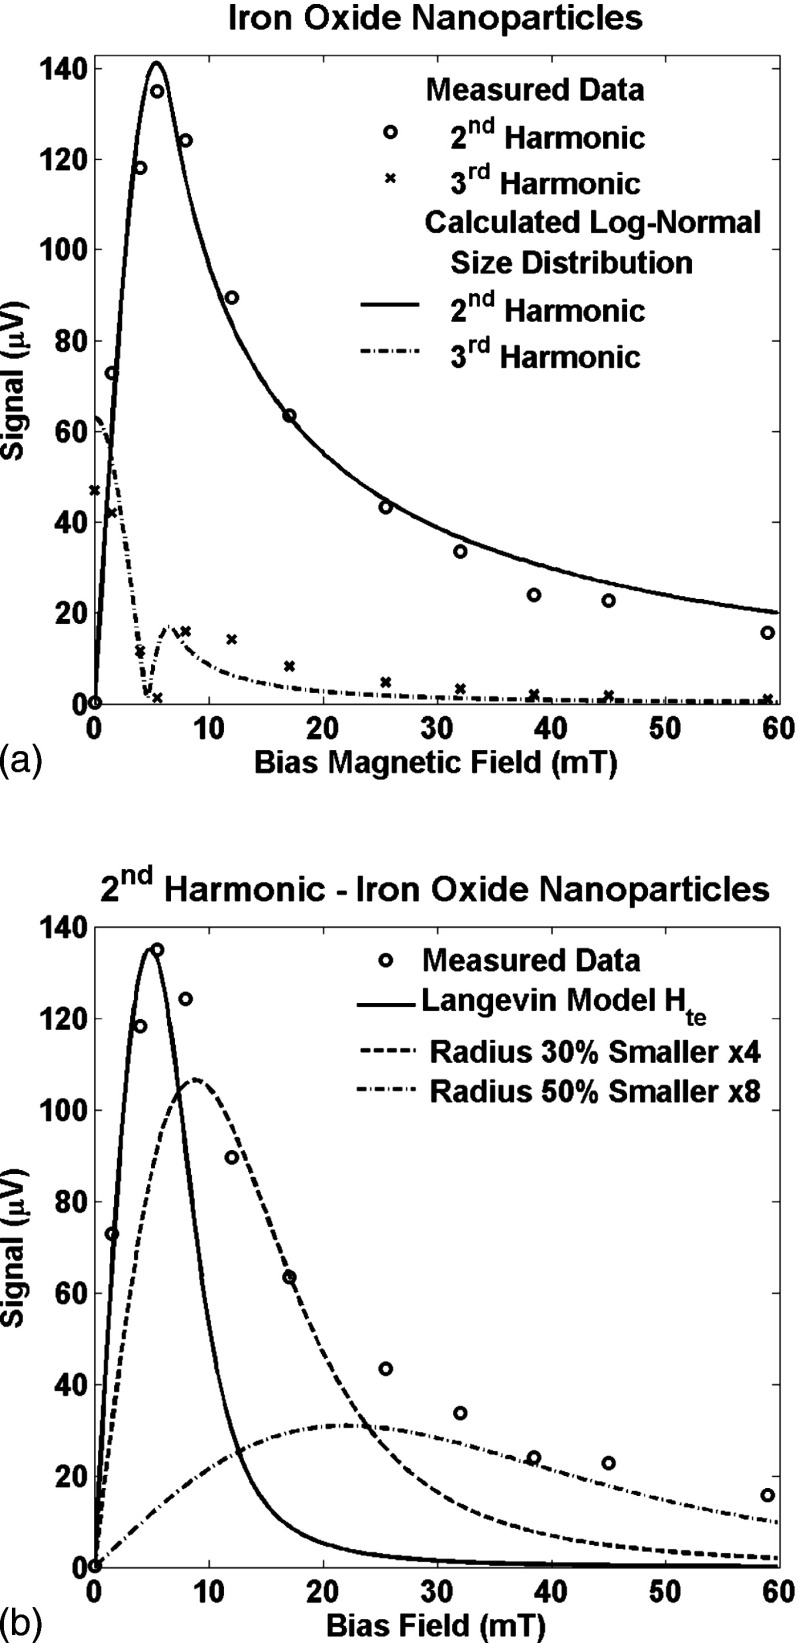
FIG. 7.
(a) The measured signal at the 2nd and 3rd harmonics as a function of the bias field, , for a sample of iron oxide nanoparticles. The solid line is the signal calculated from a sum of Langevin functions distributed with a log-normal size distribution. The optimum fit for the three parameters was obtained iteratively and detailed in the text. The error energy was 9%. (b) The measured signal at the 2nd harmonic as a function of the bias field as shown in Fig. 7(a). The solid line is the signal calculated from a single Langevin function with which is the value calculated from the ratio of the signals at the 3rd and 5th frequencies at zero bias field. The function is normalized so the maxima are equal to that of the measured data. It is clear that the Langevin function fits the data only for smaller bias fields. Two other Langevin functions are shown that were calculated with representing smaller nanoparticles: first with a radius which is 70% of that of the first Langevin function, , amplified by a factor of 4, and second with a radius which is 50% of that of the first Langevin function, , amplified by a factor of 8.

