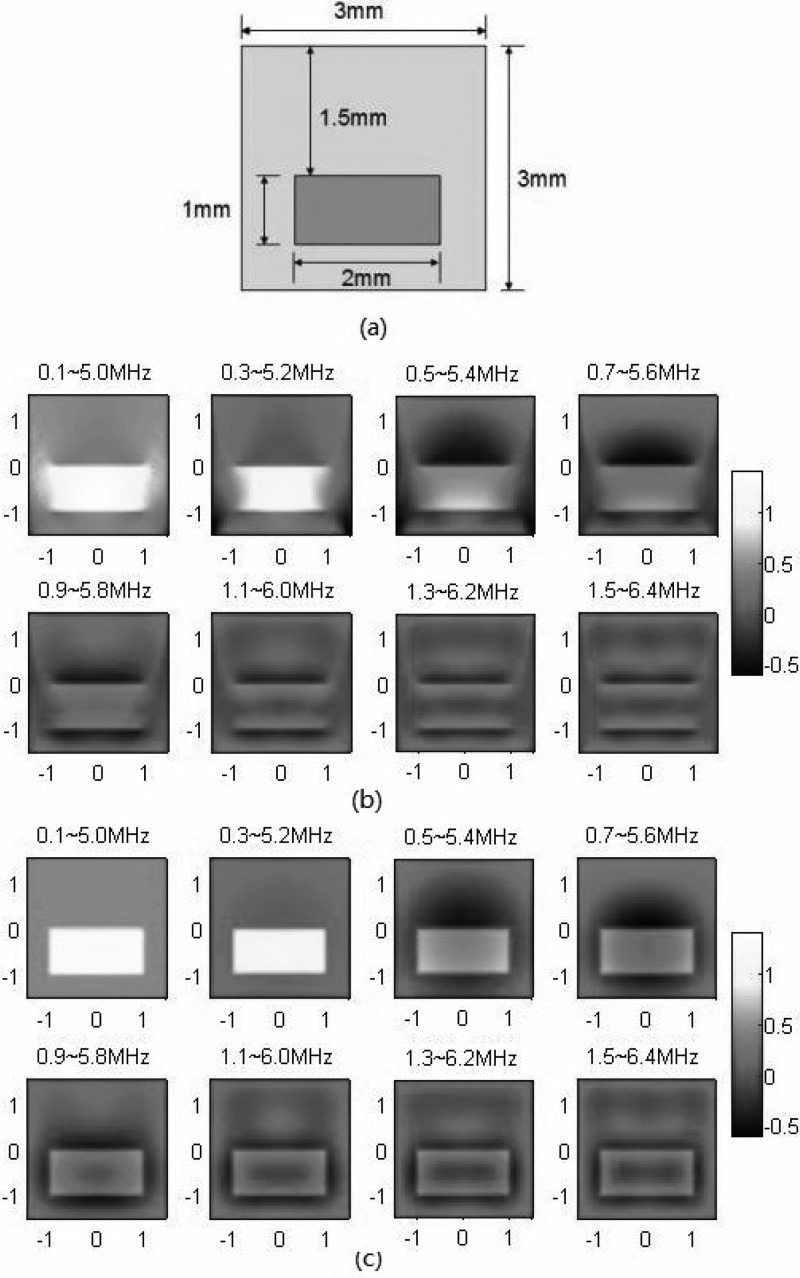
FIG. 3.
PAT simulations with time domain finite element method. (a) Simulation geometry; (b) simulation results of different frequency ranges when detectors are placed along the top boundary; (c) simulation results of different frequency ranges when detectors are positioned along all four boundaries. The color scale records the absorption coefficient in mm−1.

