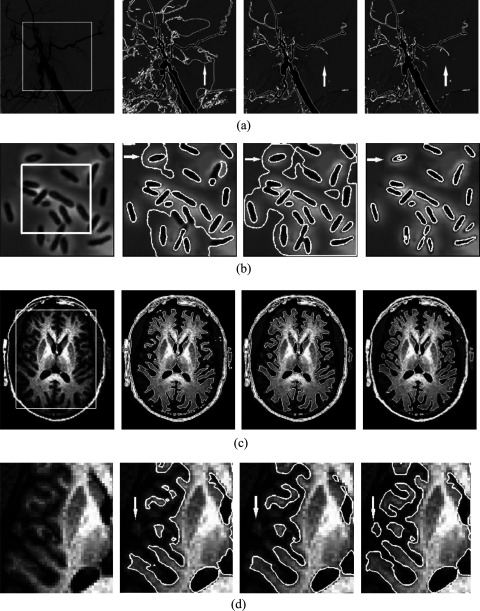
FIG. 1.
Segmentation results on (a) digital subtraction vessel image using RSF model (second column), GCS model (third column), and our method (fourth column), (b) electronic microscope chromosomal image, and (c) brain MR image. (d) shows the enlarged view of the middle left portion of (c). The white curves indicate the outlines of the segmented regions, and the white arrows represent the locations where the three segmentation methods provided markedly different results.

