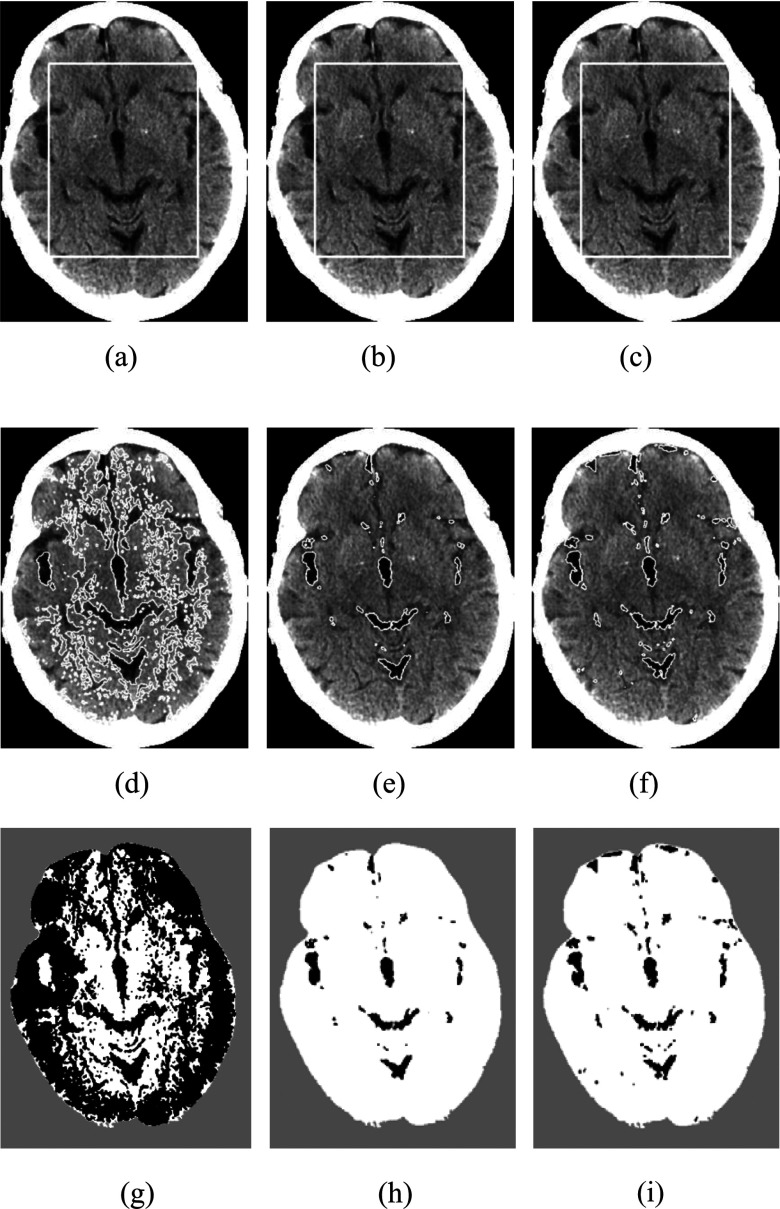
FIG. 8.
Comparison of our model with the RSF model and the GCS model on a CT brain image. The three rows show the initial contours, the final contours, and the binary segment results. Column 1: RSF model, column 2: GCS model, column 3: our model. The results of the RSF model and the GCS model are their best results by use of many different combinations of parameters.

