
Figure 4.
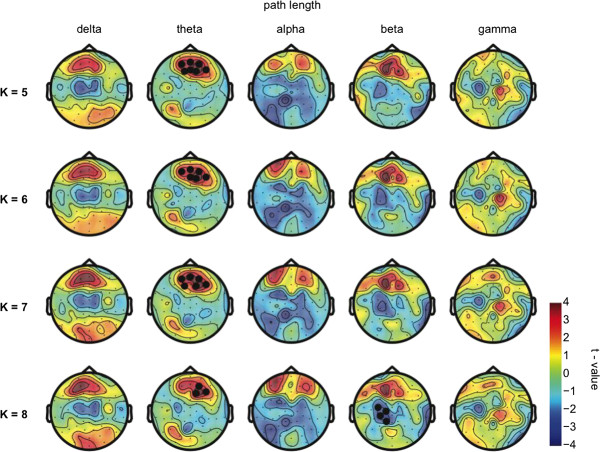
Global integration. The difference in distribution of path length (L) during resting wakefulness following sleep deprivation as compared to wakefulness following a normal night of sleep. For all frequencies, the topographies show the uncorrected t-values plotted on the scalp for different values of K (5, 6, 7, and 8). Thick black dots indicate electrodes belonging to significant clusters (Monte-Carlo P-value < 0.02) in the eyes closed resting state. Note that there is a consistent frontal significant increase in L in the theta frequency band.