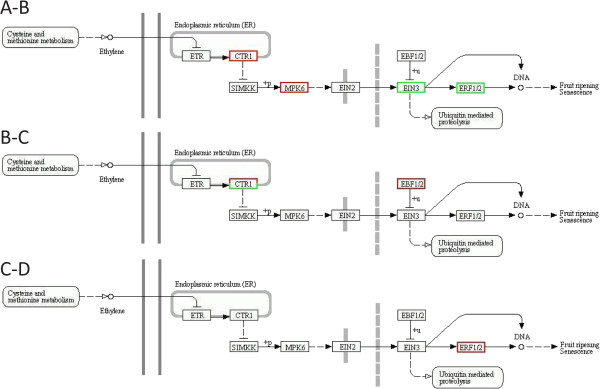
Figure 11.

The ethylene sensing pathway. (A-B) Unigenes that participate in the ethylene sensing pathway and are differentially expressed in the transition from stage A to stage B (B-C) Unigenes that participate in the ethylene sensing pathway and are differentially expressed in the transition from stage B to stage C (C-D) Unigenes that participate in the ethylene sensing pathway and are differentially expressed in the transition from stage C to stage D. A red frame indicates up-regulated unigenes and a green frame indicates down-regulated unigenes.
