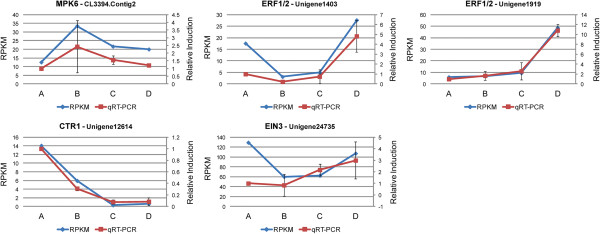
Figure 14.

Expression profiles of five ethylene sensing transcripts. Patterns of expression of MPK6 (CL3394.Contig2), ERF1/2 (Unigene1403), ERF1/2 (Unigene1919), CTR1 (Unigene12614) and EIN3 (Unigene24735), determined by qRT-PCR (relative induction compared to stage A) and RNAseq analysis (RPKM values). Error bars represent the standard deviation of the means.
