
Figure 2.
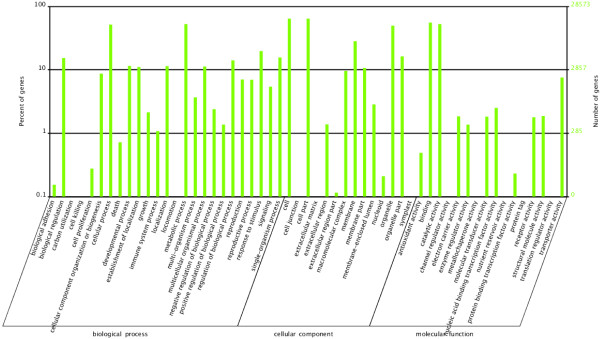
Gene Ontology classification of the total assembled unigenes. The left side and the right side of the panel show the percentage of genes and the number of genes that are classified in the corresponding term, respectively.
Official websites use .gov
A
.gov website belongs to an official
government organization in the United States.
Secure .gov websites use HTTPS
A lock (
) or https:// means you've safely
connected to the .gov website. Share sensitive
information only on official, secure websites.
Gene Ontology classification of the total assembled unigenes. The left side and the right side of the panel show the percentage of genes and the number of genes that are classified in the corresponding term, respectively.