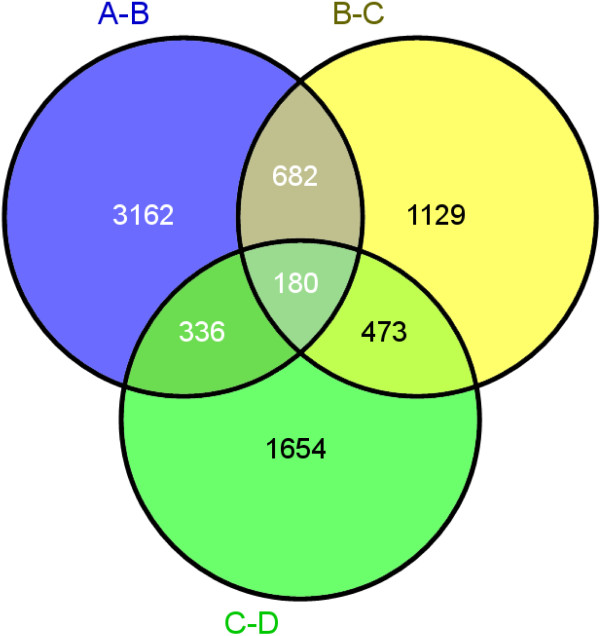
Figure 4.

Venn diagrams of the unique, differentially expressed unigenes in three pairs of the developmental stages. (A-B) Differentially expressed unigenes in the transition from stage A to stage B (B-C) Differentially expressed unigenes in the transition from stage B to stage C (C-D) Differentially expressed unigenes in the transition from stage C to stage D.
