
Figure 8.
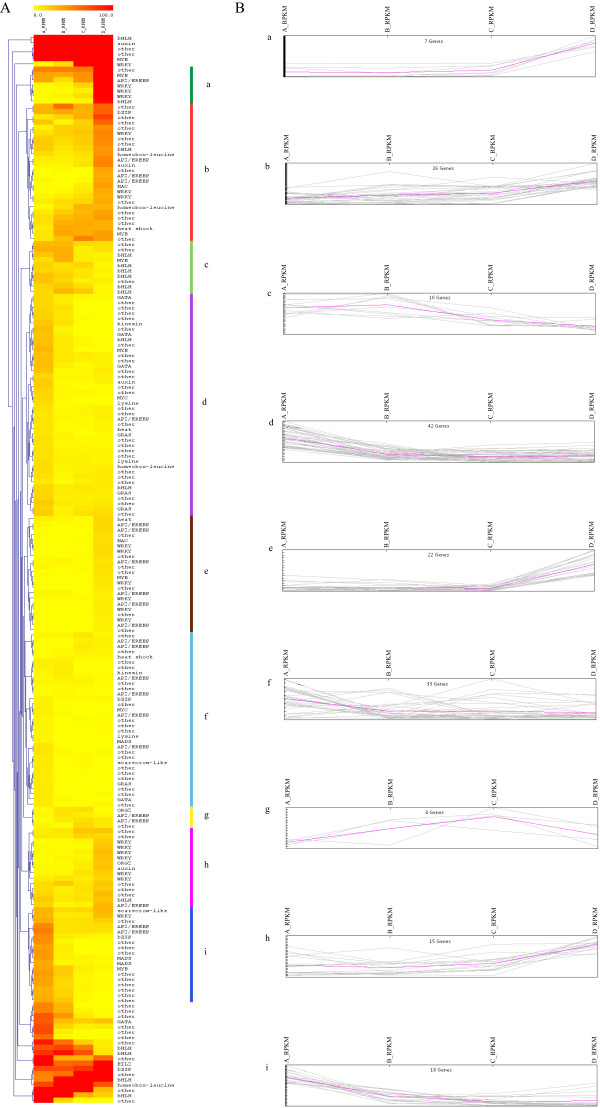
Hierarchical clustering and expression patterns of differentially expressed TFs during senescence. (A) Hierarchical clustering of the differentially expressed TFs using Euclidean distance. On the right side bars of various colours are used to determine distinct clusters (B) Expression patterns that correspond to the clusters of the histogram. Each line represents a transcript in the corresponding senescent stage where expression values are represented as RPKM values.