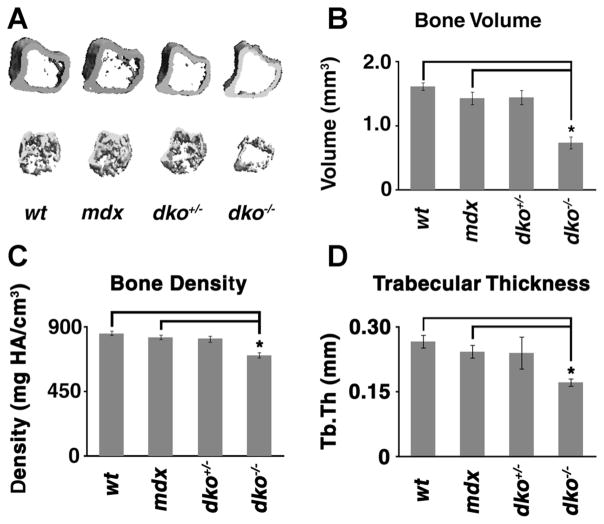
Figure 1.
Micro-CT analysis of the proximal tibia of dko−/− mice. Age-matched, 6 weeks old, male wild-type (wt), mdx, dko+/−, and dko−/− mice were anesthetized and analyzed using micro-CT. The proximal tibia was selected for 3D evaluation. Representative images are displayed in (A). Proximal tibia bone volume (B), bone density (C), and trabecular thickness (Tb.Th; D) were determined. The mean values for each genotype are displayed and error bars represent one standard deviation above and below the mean. Asterisks (*) denote statistical differences with p values <0.005.

