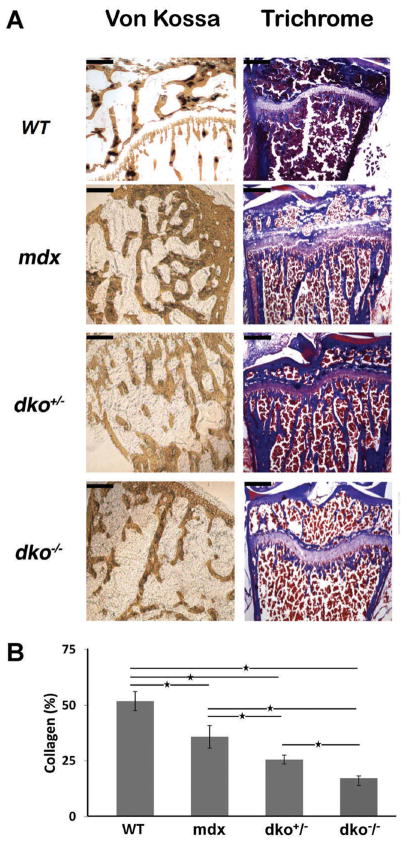
Figure 2.
Histological analysis of the proximal tibia from dko−/− mice. (A) Age-matched, 6 weeks old, male wild-type, mdx, dko+/−, and dko−/− mice were sacrificed and the proximal tibia was processed for histological analysis with von Kossa and Masson trichrome staining. Representative images are shown. Scale bars in the upper left-hand corner represent 0.2 mm (at 4× magnification). (B) For trichrome analysis, the amount of collagen per area was determined for each genotype and the results are shown. The mean values for each genotype are displayed and error bars represent one standard deviation above and below the mean. Asterisks (*) denote statistical differences with p values < 0.05.

