Fig. 5.
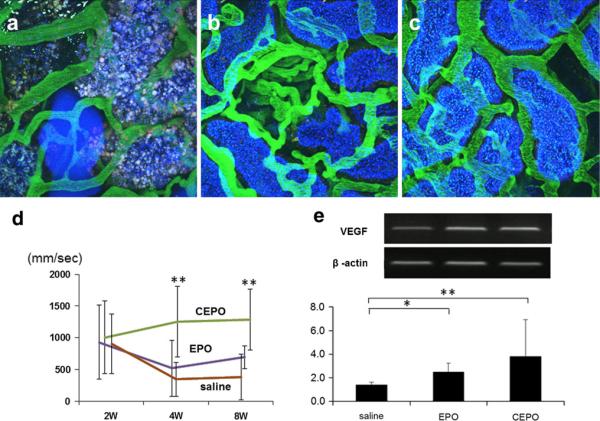
Effects of EPO or CEPO on PTC blood flow. The effect of EPO or CEPO on PTC blood flow was determined by two-photon microscopy at 8 weeks. The renal microcirculation was investigated by injection of FITC-conjugated dextran in saline-treated (a), EPO-treated (b), or CEPO-treated (c) remnant kidney (magnification ×400). Quantitative analysis using the line-scan method showed the blood flow rate of PTC in saline-treated (brown line), EPO-treated (purple line), or CEPO-treated (green line) remnant kidney (d **p < 0.01). RT-PCR demonstrated that EPO or CEPO induced VEGF mRNA compared with saline-treated remnant kidney (e)

