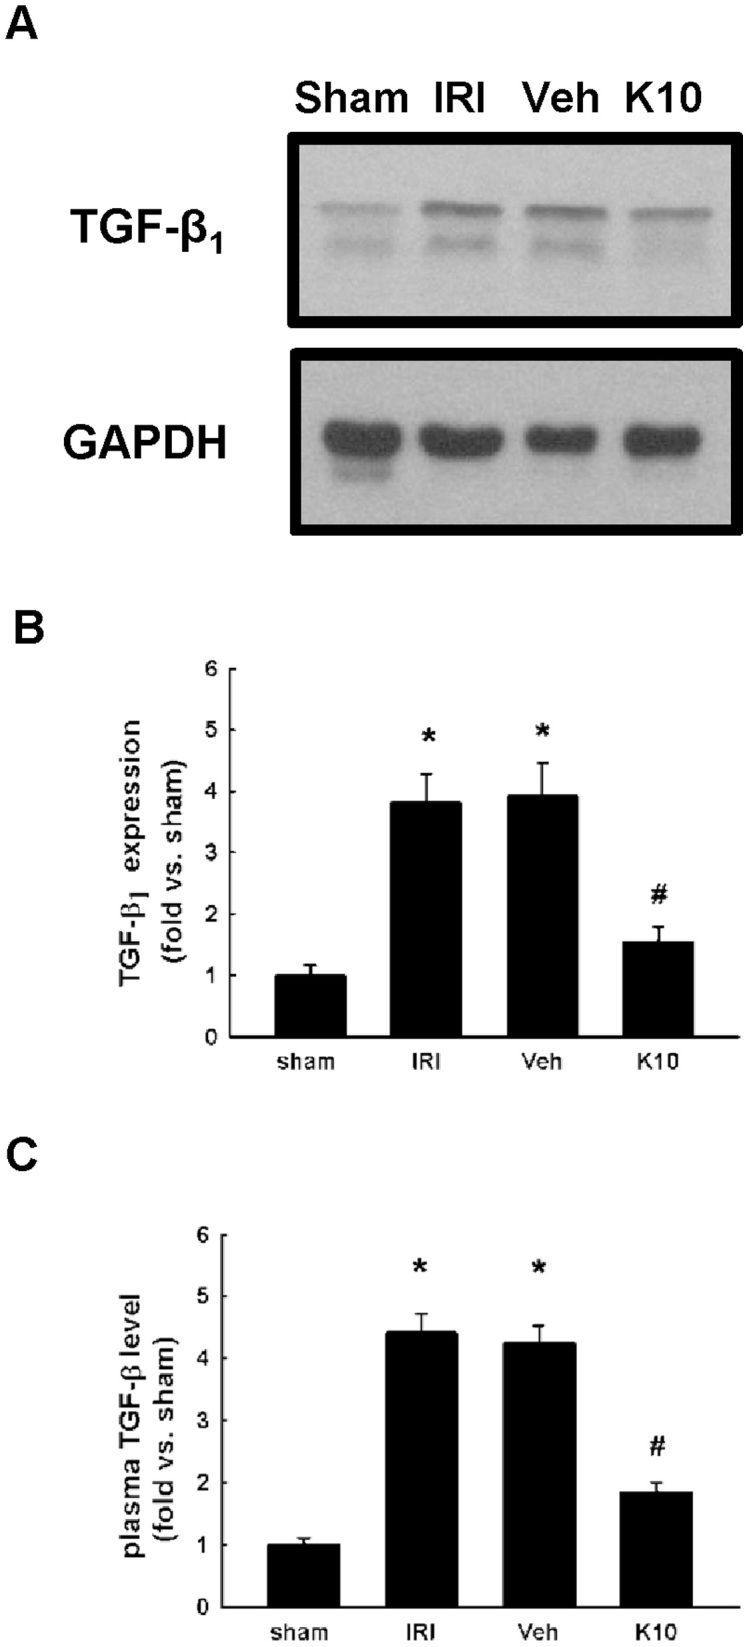
Figure 3. KS370G regulates the expression of TGF-β1 and plasma TGF-β1 levels in a murine IRI model.

(A) Western blot analysis of renal TGF-β1 expression in sham-operated (sham), ischemia-reperfusion injury (IRI), ischemia-reperfusion injury with vehicle (Veh) or KS370G 10 mg/kg (K10) treatment groups. Vehicle group was treated with RO water. (B) Quantitative results presented as mean ± SEM of the signal's optical density (n = 6 samples each group). *P < 0.01 compared with sham group. #P < 0.01 compared with IRI and Veh groups. (C) ELISA assay analysis of plasma TGF-β1 levels in sham, IRI, Veh and K10 groups. *P < 0.05 compared with sham group. #P < 0.05 compared with IRI and Veh groups.
