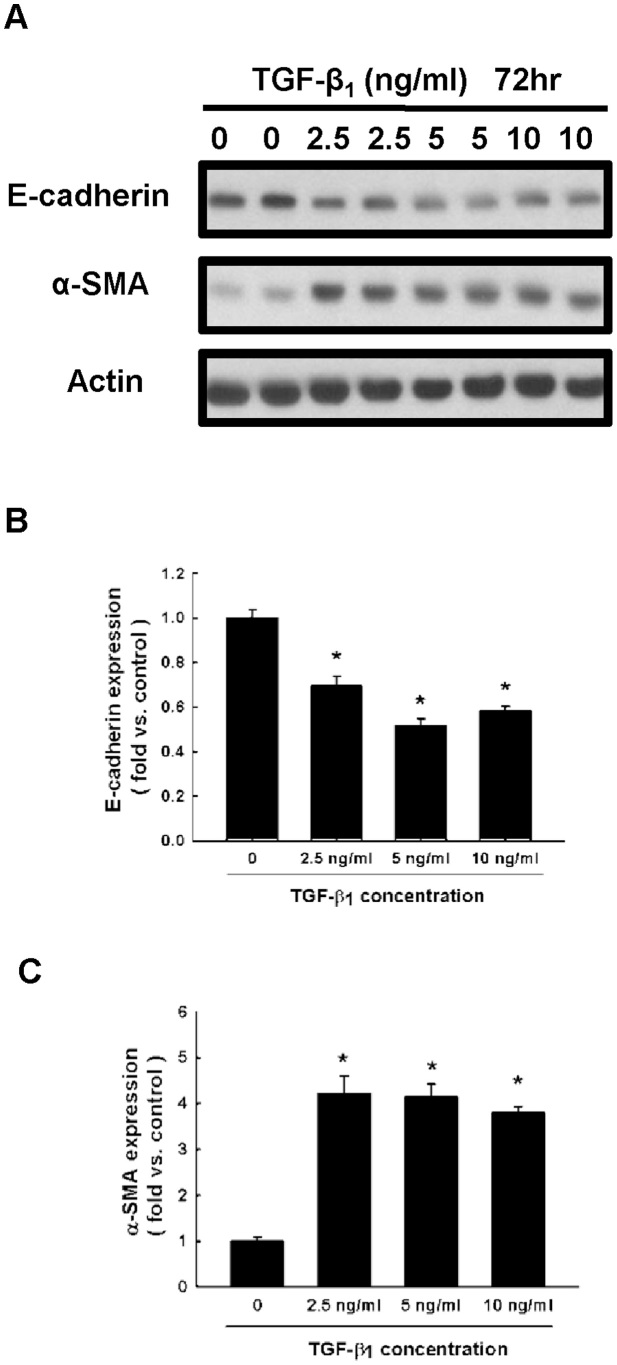
Figure 4. TGF-β1 stimulates the expression of E-cadherin and α-SMA in NRK52E cells.
(A) E-cadherin and α-SMA expression were determined by western blot of NRK52E cells cultured for 72 h in different concentration of TGF-β1. (B and C) Quantitative results presented as mean ± SEM of the signal's optical density for E-cadherin (B; n = 5) and α-SMA (C; n = 5). *P < 0.05 compared with control group.

