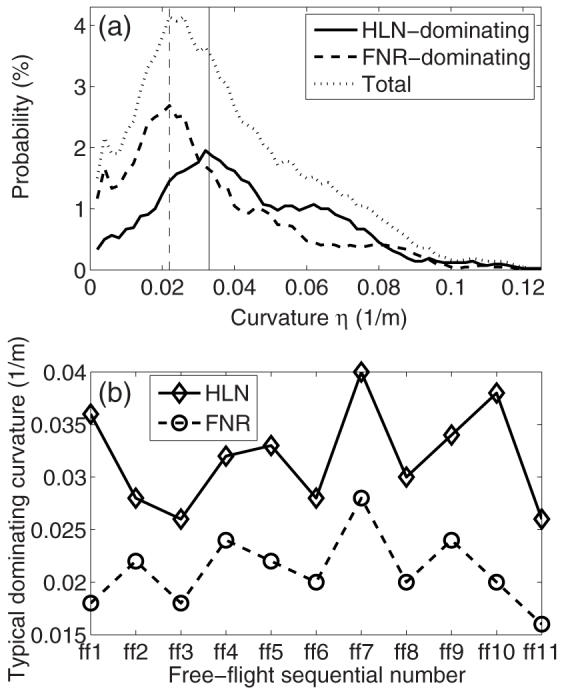
Figure 5.

(a) Probability density function showing the dominating probabilities of HLN and FNR. The peaks of the HLN and FNR curves are at η = 0.022 (1/m) (vertical dashed line) and 0.033 (1/m) (vertical solid line), respectively. These two peaks are the typical dominating curvatures of HLN and FNR. (b) The typical dominating curvatures of HLN and FNR in the 11 free flight datasets. The typical dominating curvatures of HLN are all much higher than those of FNR.
