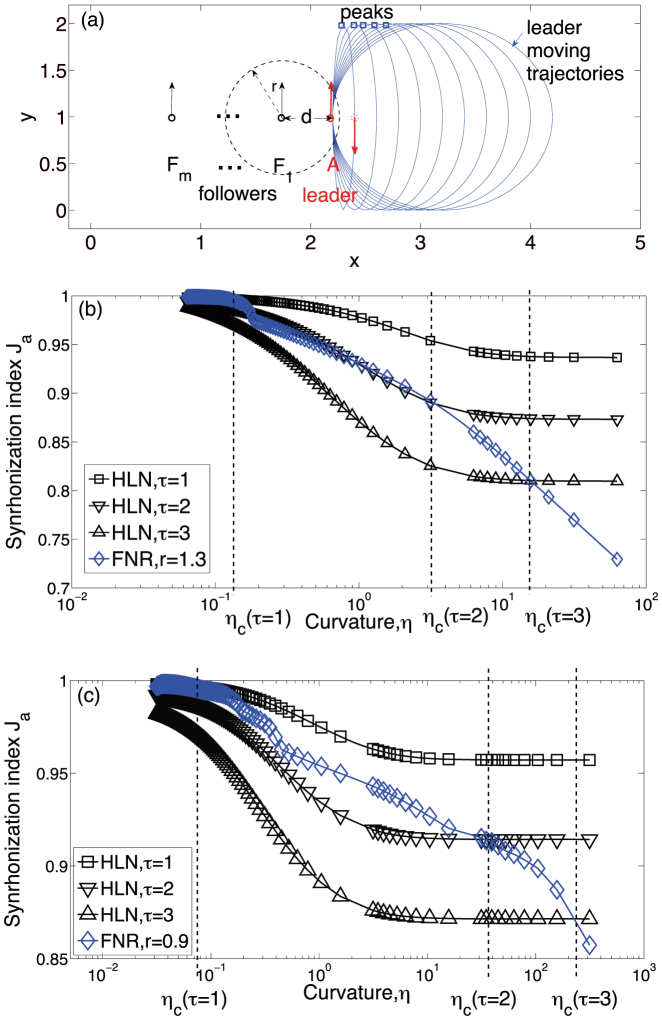
Figure 6.
(a) Illustration of the theoretical model where the leader A moves along smoother trajectories as the sizes of the ellipsoids increase. The hierarchical leadership network is  . Moreover, due to the periodical boundary condition, no agent other than the leader A can completely escape the influence of others. (b), (c) The synchronization index Ja of HLN and FNR increases with the trajectory curvature η. The parameters were set as: (b) L = 2.2, r = 1.3, m = 2, d = 0.7, and ω = π/50; (c) L = 2.2, r = 0.9, m = 6, d = 0.4, and ω = π/200. The initial speed was set to 0.03L and we tested different time delays. In this model, FNN is equivalent to FNR, e.g., FNR with r = 0.9 is equal to FNN with n = 4, and FNR with r = 1.3 is equal to FNN with n = 1. Each point is the average of 200 samples around the ellipse peak. According to the synchronization index Ja, HLN outperforms FNR for large curvatures beyond a specified threshold ηc, as indicated by the vertical lines in (b) and (c). Note that the displacements in (a) do not have a unit, thus the curvatures in (b) and (c) also have no unit.

