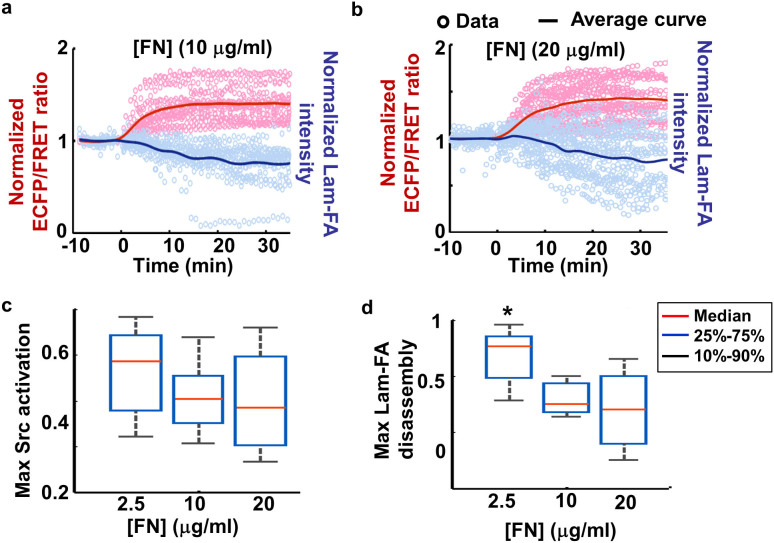
Figure 4. Fibronectin concentration affects the magnitude of Lam-FA disassembly.
(a–b) Quantified results for MEFs seeded on (a) 10 μg/ml and (b) 20 μg/ml FN: the time courses of normalized Src ECFP/FRET ratio (pink circles) and the normalized total paxillin intensity (light blue circles) from different individual cells, and their corresponding average curves (red and blue solid lines); (c–d) show the statistics of (c) the maximal Src activation and (d) Lam-FA disassembly by whisker plots. (*) indicates statistically significant difference between the data distribution using the Kolmogorov-Smirnov (KS) test, n = 20, 23 and 33, p ≤ 6.1e-4.

