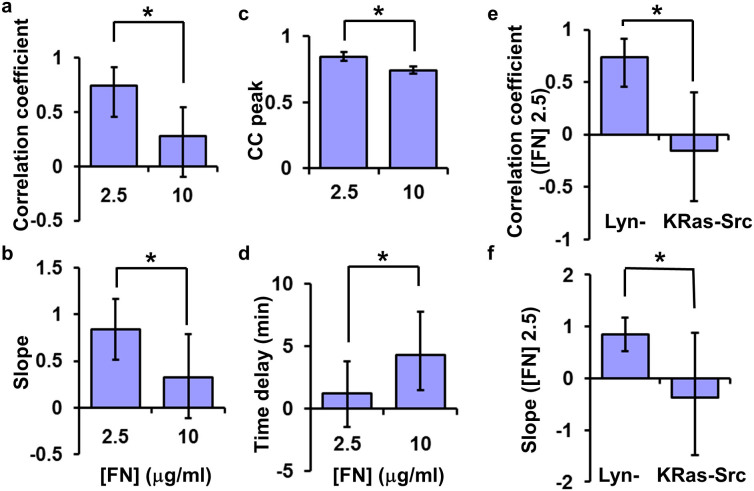
Figure 5. Fibronectin concentration affects the Src-FA coordination in magnitude and kinetics.
(a–b) The bar graphs represent parameters in Src-FA magnitude coordination: (a) the correlation coefficients and (b) the slopes of the linear models on different [FN]. (*) indicates significant difference based on the randomized test. Correlation coefficient: p = 0.02; Slope: p = 0.04. (c–d) show the parameters for the Src-paxillin kinetic coordination. Bar graphs represent (c) the maximal value (CC peak) and (d) the time delay of the Src-FA CC curves for cells seeded on different [FN], respectively. (*) indicates significant difference, p ≤ 0.04. (e–f) The comparison of (e) the correlation coefficients and (f) the slopes of the linear model between the Lyn-Src/Lam-FA and KRas-Src/Lam-FA coordinations. (*) indicates significant difference with p < 2.0e-4.

