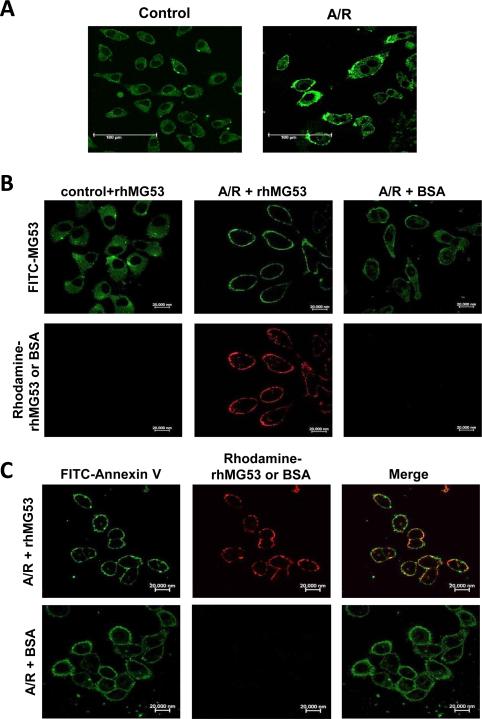
Figure 4.
Localization of MG53 to the surface membrane of A549 cells after treatment with anoxia and reoxygenation (A/R). A. Immunofluorescence staining of endogenous MG53 in A549 cells. Control cells show cytosolic distribution of MG53 and A/R treated cells display membrane localization of MG53. B. Top panels show FITC-staining of endogenous MG53 in control cells (left), A/R treated cells (middle and right). Bottom panels show Rhodamine-labeled rhMG53 added to control cells (left) and A/R treated cells (middle), or Rhodamine-labeled BSA added to A/R treated A549 cells (right). C. Left panels show FITC-labeling of Annexin V in A/R treated A549 cells following incubation with rhMG53 (top) or BSA as control (bottom). Middle panels show Rhodamine-labeling of rhMG53 (top) or lack of Rhodamine-labeling of BSA (bottom) in A/R treated A549 cells. Right panels show colocalization of Annexin V and rhMG53 (top) and lack of colocalization between Annexin V and BSA (bottom) in A/R treated A549 cells. The images shown were representative of > 104 cells in at least four separate experiments.

