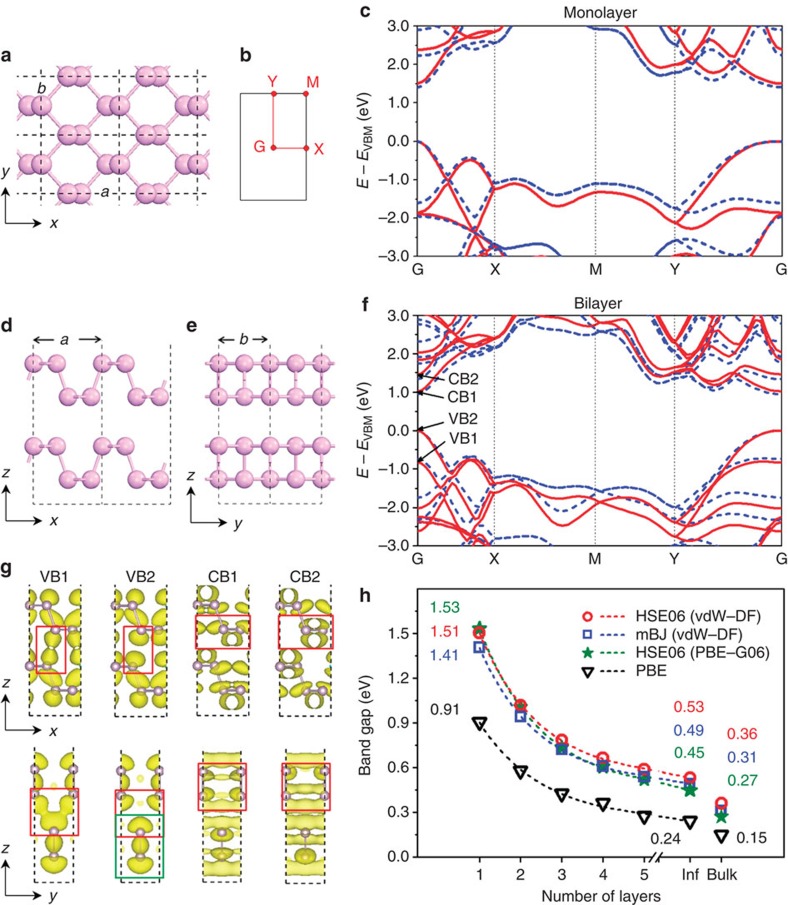
Figure 2. Electronic structures of few-layer BP.
(a,b) Top view of the atomic structure of the monolayer and the associated Brillouin zone. (d,e) Side views of the atomic structure of the bilayer. (c,f) Bandstructures of monolayer and bilayer BP calculated with the HSE06 functional (red solid lines) and the mBJ potential (blue dashed lines), respectively. Two valence (VB1 and VB2) and two conduction states (CB1 and CB2) are marked in panel f. (g) Spatial structure of wavefunctions for the four marked states illustrated in the xz and yz planes using an isosurface of 0.0025 e Å−3. (h) Evolution of the direct bandgaps as a function of the sample thickness. Functionals used for structural optimization are shown in parentheses. Bandgap values are marked for the monolayer system, for the extrapolation of our results and for real bulk BP.

