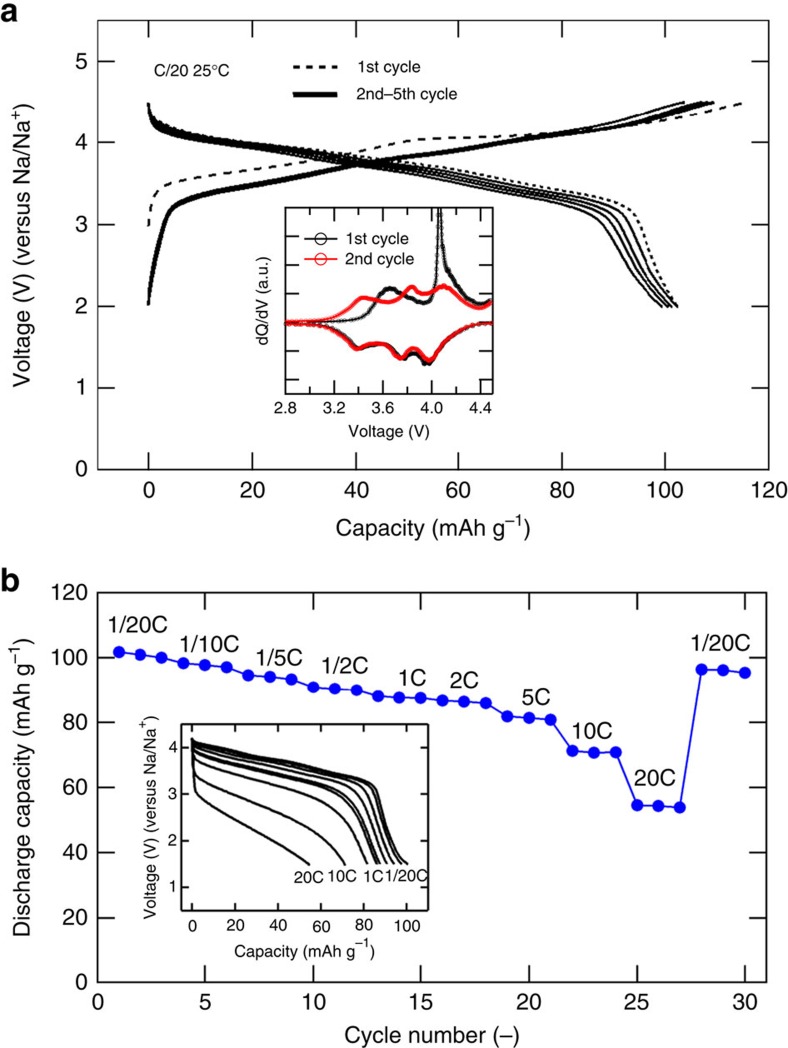
Figure 3. Electrode properties of Na2−xFe2(SO4)3 in Na cell.
(a) Galvanostatic charging and discharging profiles of Na2−xFe2(SO4)3 cathode cycled between 2.0 and 4.5 V at a rate of C/20 (2 Na in 20 h) at 25 °C. First (1st) cycle is shown in dashed black line, and 2nd–5th cycle in solid black lines. (Inset) The differential galvanostatic profiles (dQ/dV) of Na2−xFe2(SO4)3 cathode showing two distinctive peaks during the first charge and broader three peaks upon subsequent discharging/charging processes. (b) Capacity retention upon cycling up to 30 cycles under various rate of C/20 (2 Na in 20 h) to 20C (2 Na in 3 min). (Inset) The discharge curves of Na2−xFe2(SO4)3 as a function of rate (from C/20 to 20C). Before each discharge, the cells were charged at C/10 to 4.2 V.

