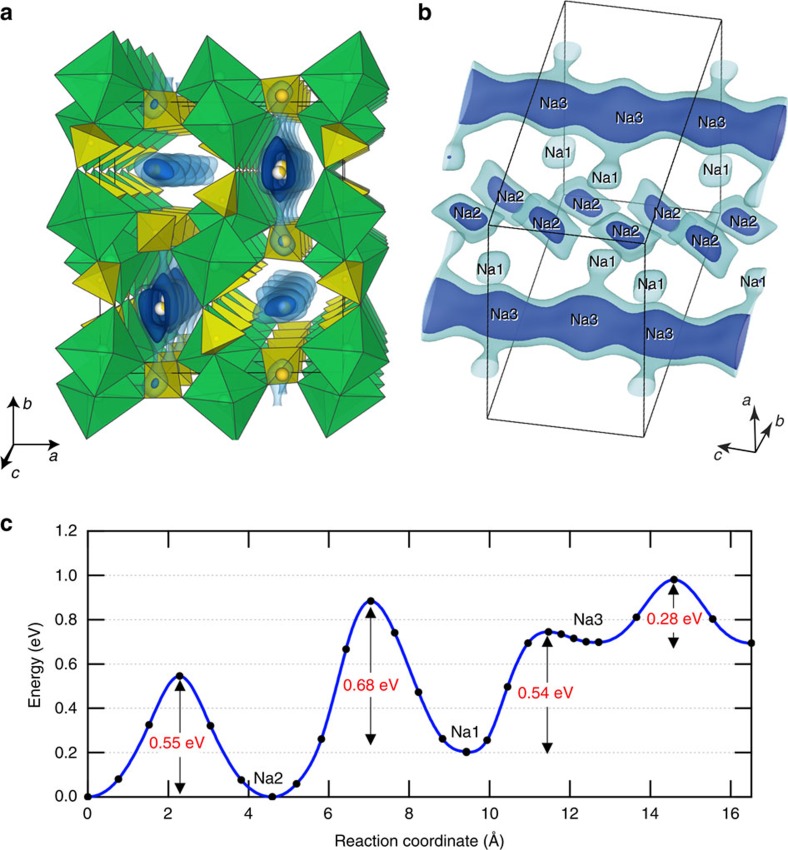
Figure 4. Na-ion diffusion in Na2Fe2(SO4)3.
(a,b) Equi-value surface of the ΔBVS. The blue and light-blue surfaces are for ΔBVS=0.2 and 0.4, respectively. Inner side of the surface corresponds to accessible spaces for the Na ions. Green and yellow polyhedra are that of FeO6 and SO4, respectively. (c) Migration activation energy of Na+ ion calculated with DFT. Shown are the values (from left to right) for migrations along the c axis for the Na2 sites, between Na2 and Na1 sites, between Na1 and Na3 sites, and along the c axis for the Na3 sites. Calculations are done at low concentration of Na.

