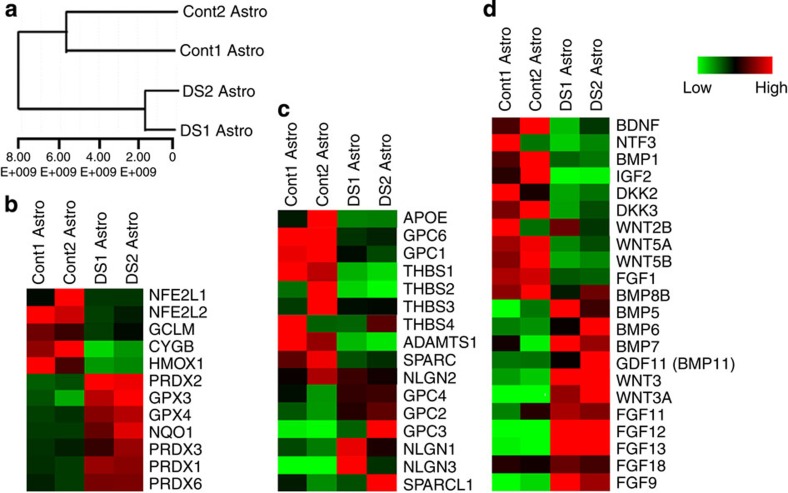
Figure 6. Gene expression analysis of DS and control astroglia.
(a) Dendrogram showing that two control astroglia (Cont 1 and 2) and two DS astroglia (DS 1 and 2) cluster closer to each other, respectively. (b–d) Heatmaps focusing on gene transcripts encoding antioxidants and key factors in the reactive oxidative stress (b), and factors secreted by astroglia that have roles in synapse formation (c), and neurogenesis and maturation of neurons (d). High expressions relative to mean are coloured red. Low expressions are coloured green.

