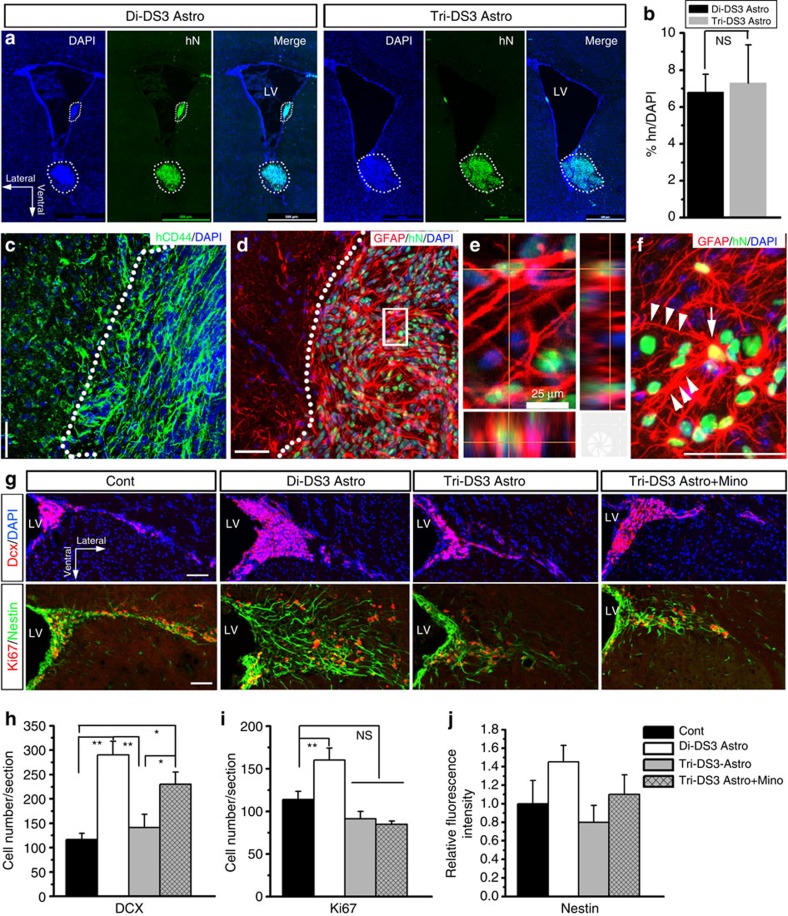
Figure 8. Transplantation of astroglia into the developing brains of Rag1−/− mice.
(a) Representative images showing that at 6 weeks after transplantation, the transplanted Di-DS3 Astros and Tri-DS3 Astros were identified by human nuclei (hN) staining. Notably, the majority of the transplanted astroglia (circled by dotted lines) were found integrated into the tissue and located at the bottom of the LVs. LV, lateral ventricle; DAPI, 4′,6-diamidino-2-phenylindole dihydrochloride. Scale bars, 500 μm. (b) Quantitative results from brain sections showing that no difference in engraftment success (hN+ cells) was noted between Di-DS3 Astro and Tri-DS3 Astro transplantation groups (n=4–5). NS, no significance. (c) A representative image showing that the transplanted astroglia were labelled by human CD44. Scale bars, 50 μm. (d) A representative image showing that about 50% of the transplanted hN+ cells were positive for GFAP staining. The squared area in d was enlarged in e, showing the co-localization of hN and GFAP. Scale bars, 50 and 25 μm in the original and enlarged images, respectively. (f) Some transplanted astroglia showed long GFAP+ processes, as indicated by arrowheads. The arrow indicates the cell body. Scale bar, 50 μm. (g) Representative of DCX and Ki67/nestin staining in dorsal SVZ performed on sections from control (Cont) group received PBS vehicle, groups received Di-DS3 astroglia and Tri-DS3 astroglia transplant, and a group received Tri-DS3 astroglia transplant plus minocycline treatment. Scale bars, 50 μm. (h,i) Quantitative analysis of the number of DCX+ and Ki67+ cells at dorsal SVZ in the different groups. (j) Quantitative analysis of fluorescence intensity of the nestin staining. One-way analysis of variance test, n=4–6; *P<0.05, **P<0.01; Data are presented as mean±s.e.m.

