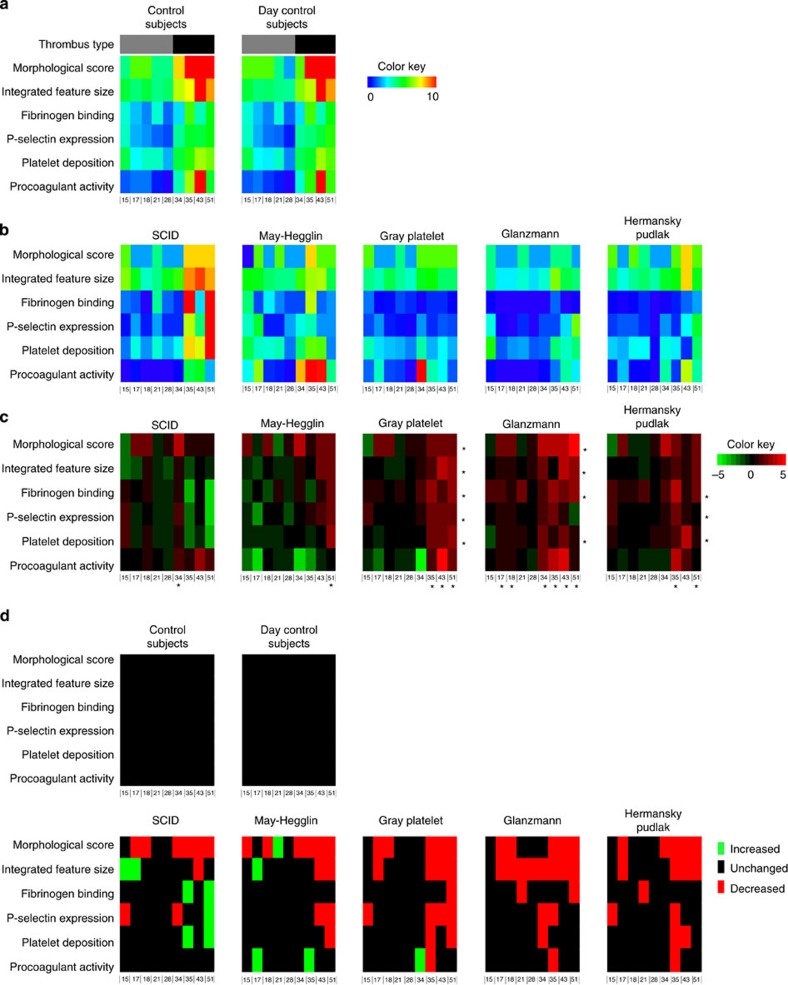
Figure 8. Abnormal thrombus formation in blood from patients with rare platelet function defects.
Whole blood from controls subjects or indicated patients was perfused over microspots of nine different surfaces (three microspots per run, 2–3 runs per surface). Surface numbering as in Fig. 1. (a) Heatmap of average parameters of thrombus formation for blood samples from control subjects (left), and blood samples from day control subjects (right). (b) Heatmaps and (c) subtraction heatmaps of parameters of thrombus formation for patients with indicated syndromes: SCID, May–Hegglin anomaly, grey platelet syndrome, Glanzmann’s thrombasthenia or Hermansky–Pudlak syndrome. *P<0.05 compared with control subjects (two-tailed Student’s t-test). (d) Significance map of parameters from a representative control subject and a day control subject, as well as from all patients. Colour key: red=deviating <mean−2 s.d.; green=deviating >mean+2 s.d., relative to normal values.

