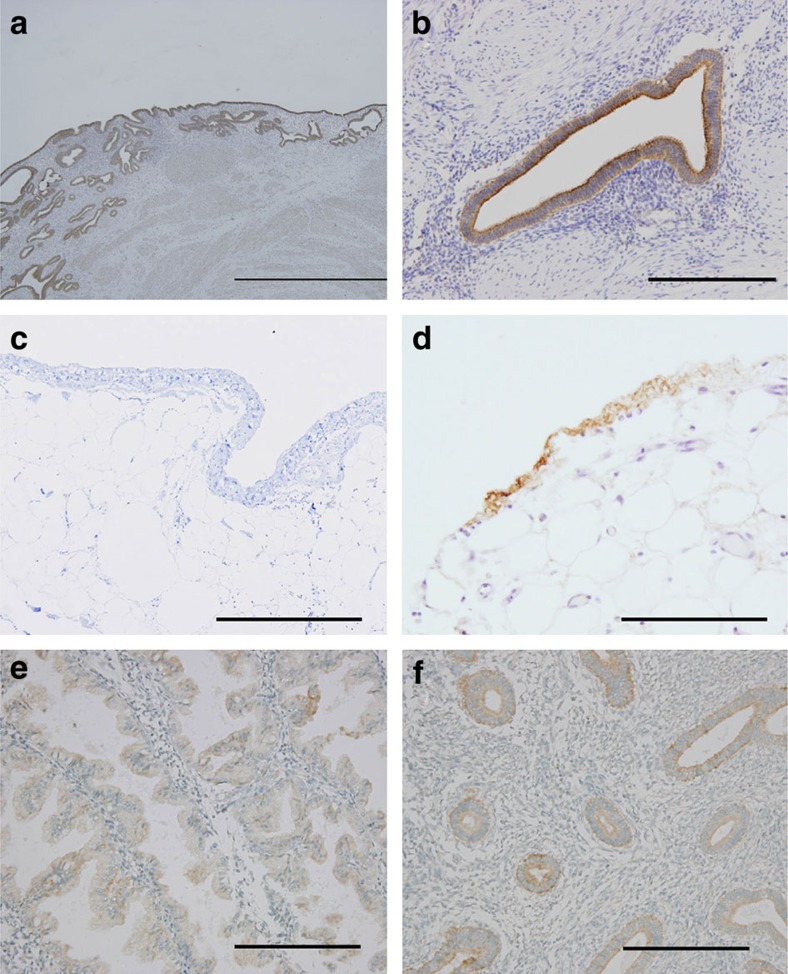
Figure 3. Immunohistochemistry of paraffin tissue sections using mouse monoclonal anti-CNGB3 antibody.
(a) Endometriosis lesions from an endometriosis patient. Scale bar, 500 μm. (b) An endometrial gland in endometriosis tissue. Scale bar, 200 μm. (c) Peritoneal tissue from a cycling woman without endometriosis. Scale bar, 100 μm. (d) Peritoneal tissue from an endometriosis patient. Scale bar, 100 μm. (e) Uterine endometrium at secretory phase. Scale bar, 200 μm. (f) Uterine endometrium at proliferative phase. Scale bar, 200 μm.

