Figure 1.

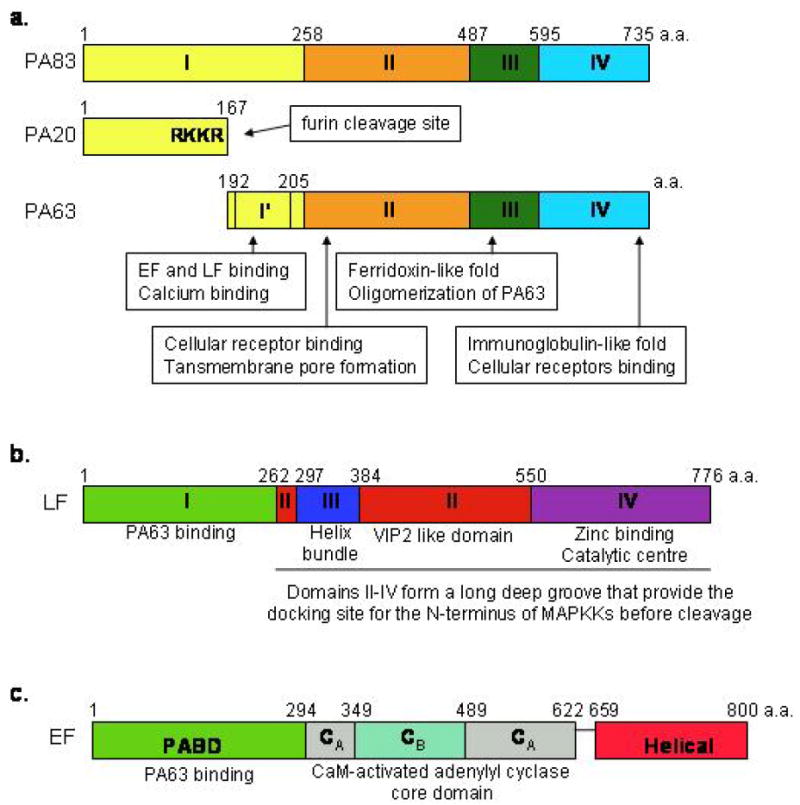
Schematic diagram of domain organization of anthrax toxin molecules. The amino acid (a.a.) boundary is indicated above each domain. (a) protective antigen (PA). (b) lethal factor (LF) (c) edema factor (EF).

Schematic diagram of domain organization of anthrax toxin molecules. The amino acid (a.a.) boundary is indicated above each domain. (a) protective antigen (PA). (b) lethal factor (LF) (c) edema factor (EF).