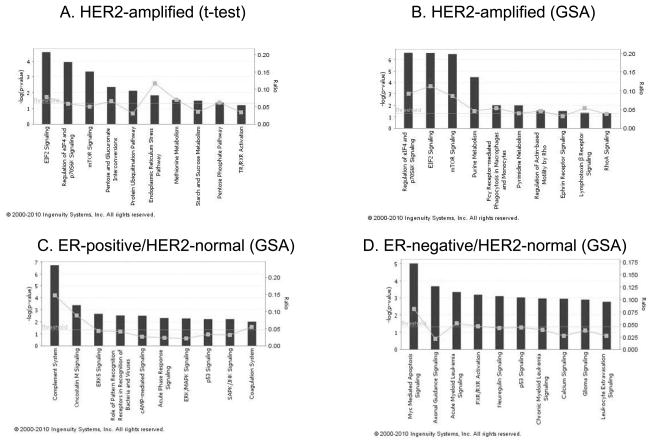
Fig. 1.
Ingenuity Pathway Analysis (IPA) software results showing the top 10 canonical pathways by significant genes overexpressed in IBC. The bars indicate −log(P-value), calculated by Fisher’s exact test. The line indicates the ratio for the percentage of genes in a pathway that were found in our uploaded list. Threshold indicates the line at P = 0.05.

