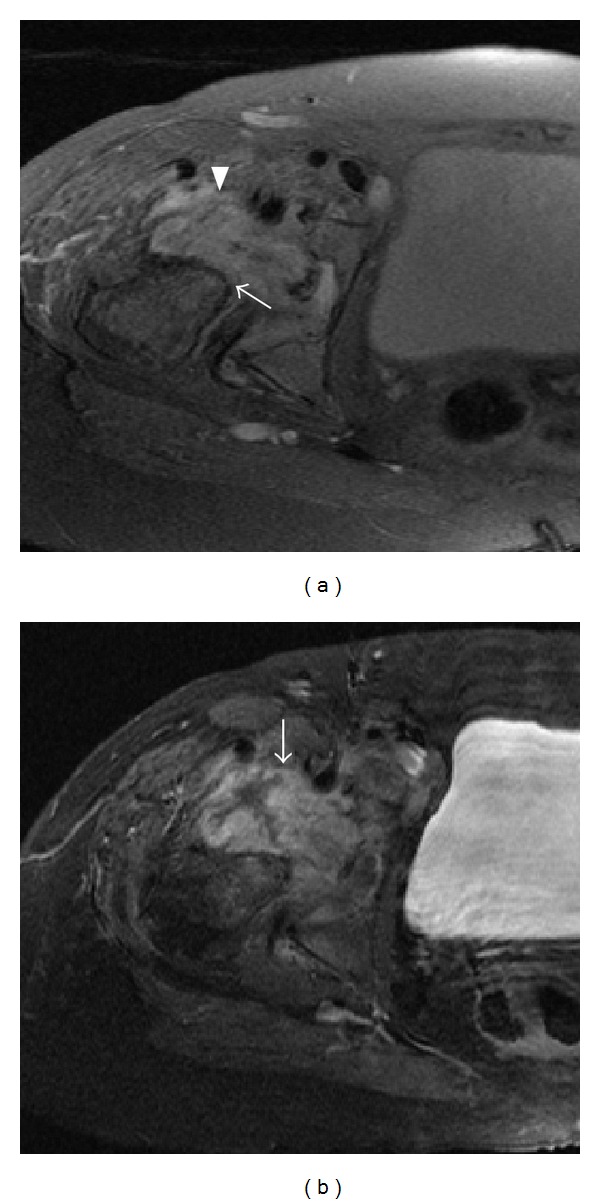
Figure 2.

(a) Axial proton density with fat saturation sequence through the right hip joint (a) shows destruction of the femoral head (arrow) and a complex joint effusion (arrowhead). (b) Axial T1 fat saturated sequence after gadolinium reveals synovial thickening and enhancement (arrow).
