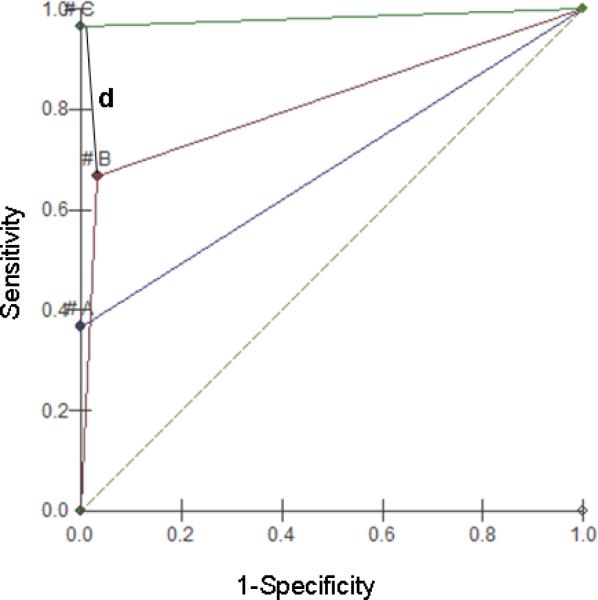
Figure 3.
Graphic representation of ROC (receiver operating characteristics) test for the RT PCR (A), RT-hemi-nested-PCR (B) e SYBR® qRT-PCR. The best performance for each method is indicated by the line d (distance). In case of methods C and A, the line d coincides with the Y axis (P. cohort to Sp=0). “#” symbol represents the cohort point for each method.

