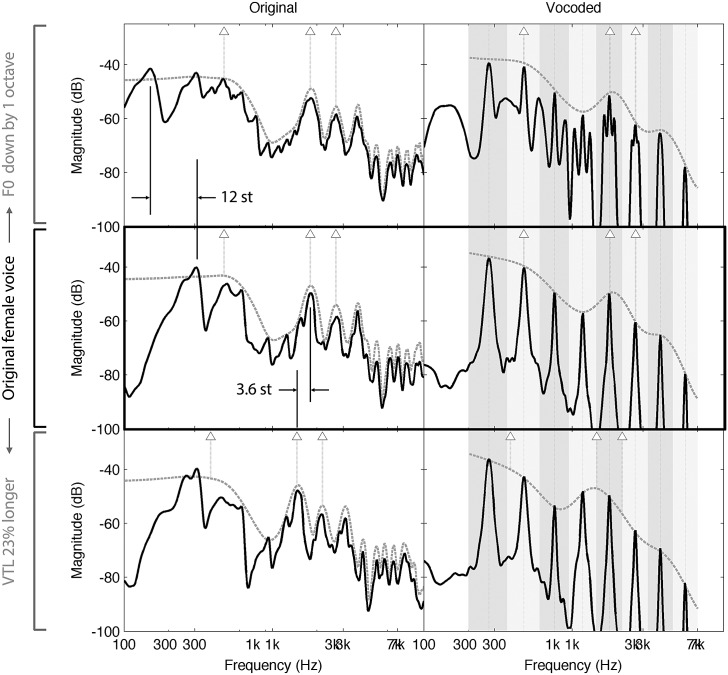
FIG. 1.
Power spectrum and waveform of the vowel /u/ in “bus”. Each row represents a different voice. The middle row shows the stimulus resynthesized, in STRAIGHT, with the original parameters of the recorded female voice. In the top row, only the F0 was changed, by an octave down. In the bottom row, only the VTL was changed to be made 23% longer, which results in shifting all the formants down by 3.6 st. The left panel shows the spectra over the duration of the vowel, for the vocoded (right column) and non-vocoded (left column, noted “Original”) versions of the stimulus. The black solid line represents the spectrum itself, making the harmonics and/or the sinusoidal carriers (and sidebands) of the vocoder visible. The dashed gray line represents the spectral envelope, as extracted by STRAIGHT on the left, and interpolating between the carriers for the vocoded sounds on the right. The triangles and stems point to the location of the first three formants, as defined by visual inspection of the STRAIGHT envelope, both for the left and right columns. In the right column, the vocoder analysis filter bands are shown with grayed areas. The frequency of the sine-wave carrier is marked with a dotted line.

