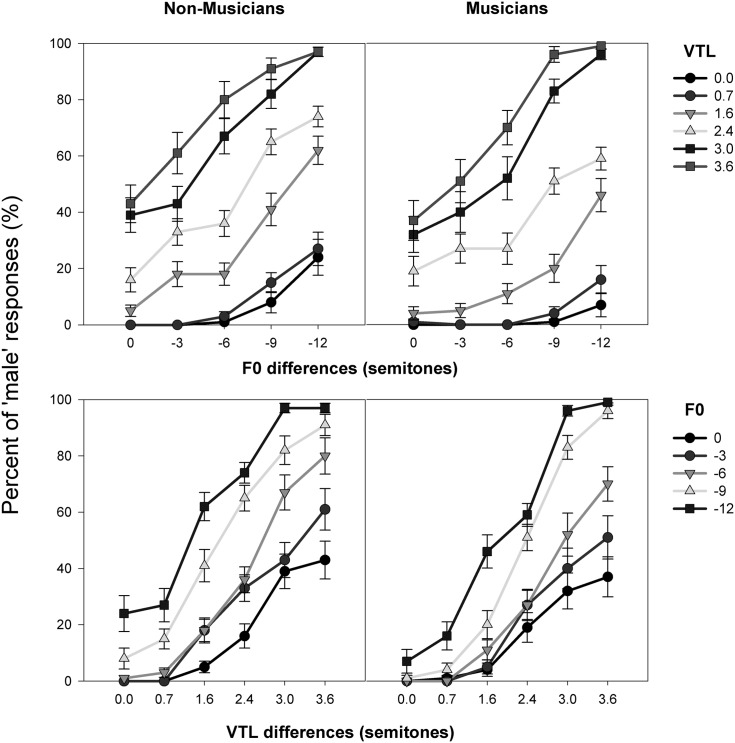
FIG. 2.
Mean gender categorization (across subjects and test words) shown for non-musicians (left panels) and musicians (right panels) tested with unprocessed (but synthesized) stimuli, as a function of the difference in F0 (top plots) or VTL (bottom plots) relative to the female source talker. Error bars denote one standard error of the mean.

