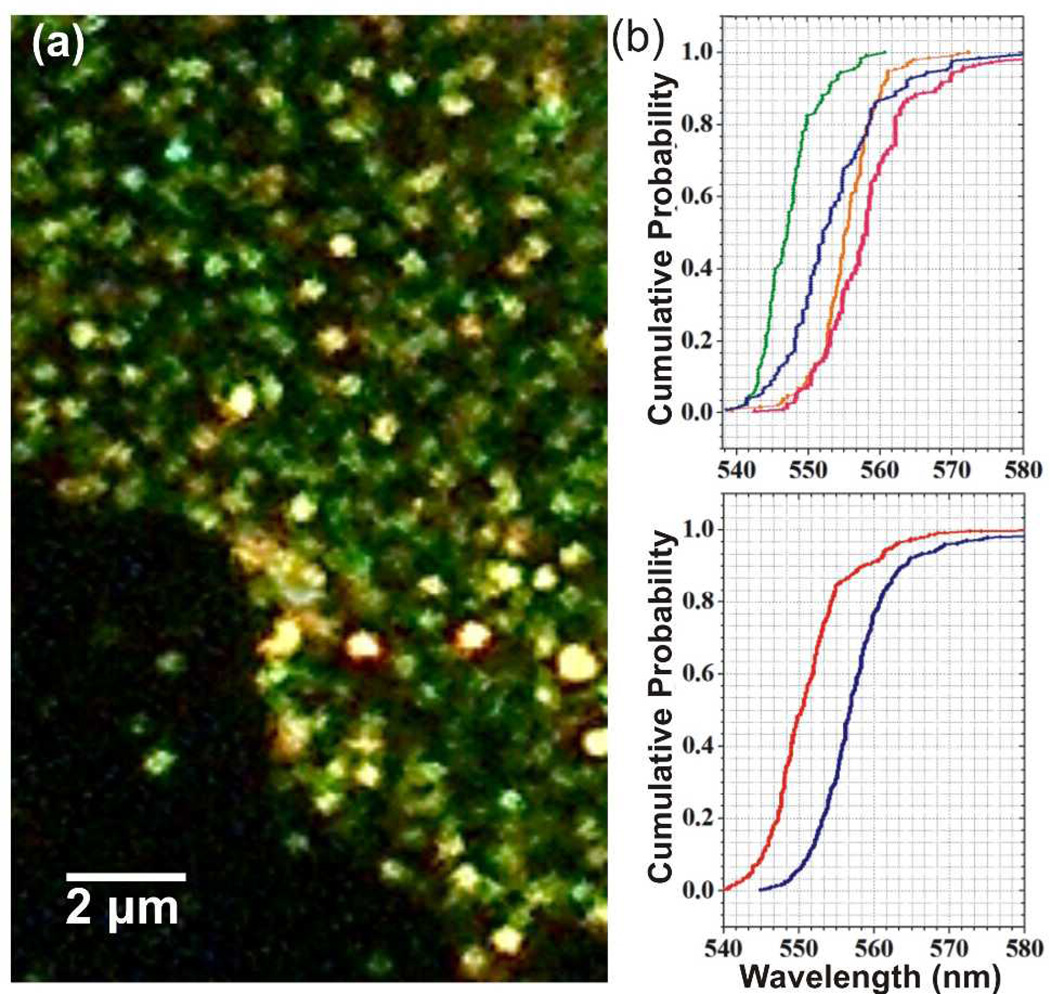
Figure 11.
a) Magnified view of a section of a MCF7 cell after labeling surface expressed CD24 with 40 nm Au NPs. b) top: cumulative distribution plots of λplas after NP labeling of the following cell/receptors: MCF7/CD44 (blue), SKBR3/CD24 (orange), MCF7/CD24 (pink). The distribution for Au NPs in ambient refractive index of nr = 1.40 is included as blue line. bottom: Cumulative distribution plot of λplas for NPs targeted at MCF7/CD24 before (red) and after (blue) treatment with m-β-CD to sequester cholesterol from the membrane. Adapted with permission from Yu et al., Anal. Chem. 85, 1290 (2013). Copyright 2013 American Chemical Society.

