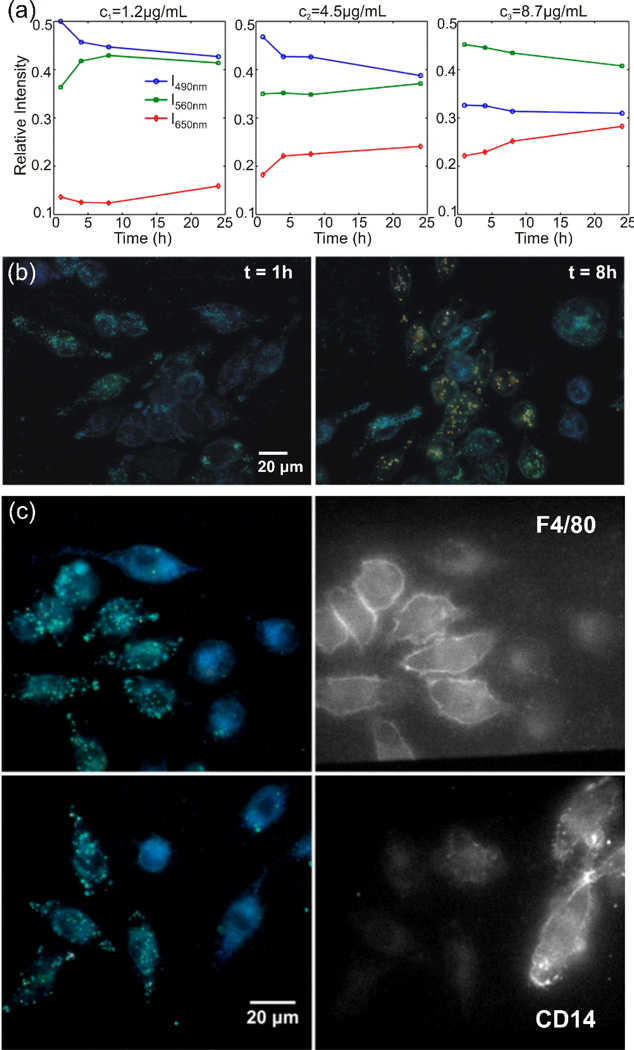
Figure 12.
a) Scattering intensities of silver NPs after uptake by J774A.1 macrophages as function of time on three wavelength channels (490 nm (blue), 560 nm (green), and 650 nm(red)) for three different NP concentrations: 1.2 µg/mL (left), 4.5 µg/mL (middle), and 8.7 µg/mL (right). b) Darkfield images of macrophages exposed to 4.5 µg/mL Ag NPs after 1h (left) and 8.7 µg/mL Ag NPs after 8h (right). c) Correlated darkfield image of NP containing macrophages (left) and fluorescence image (right) after staining with F4/80 (top) or CD14 (bottom) maturity markers. Reproduced with permission from Wang et al., ACS Nano 6, 7122 (2012). Copyright 2012 American Chemical Society.

