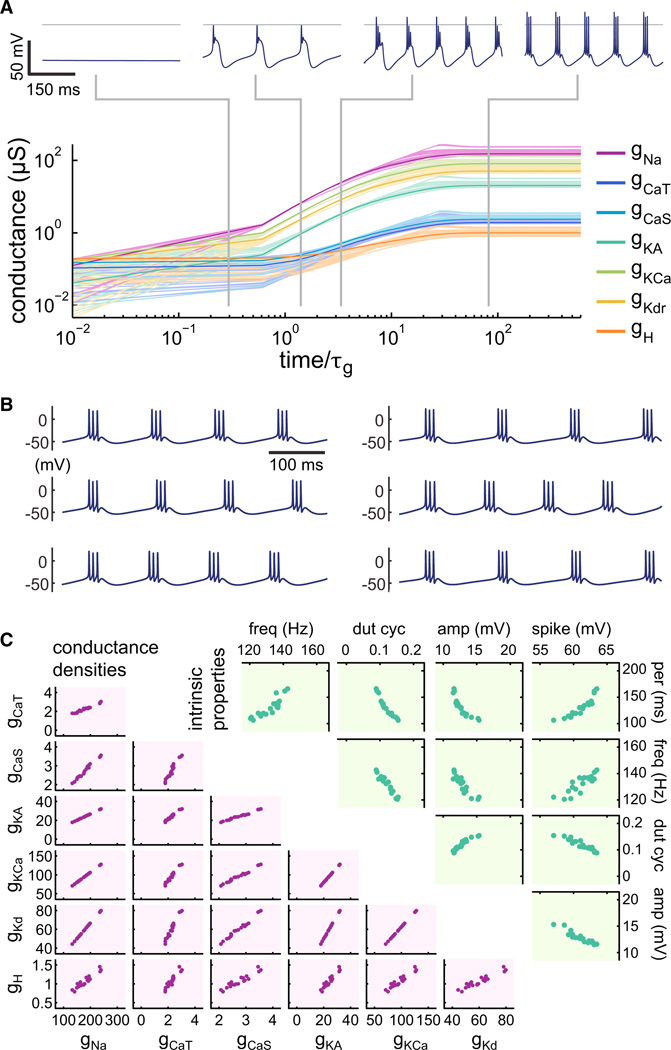
Figure 3. Regulation in a Complex Biophysical Cell Model.
(A) Time evolution of a self-regulating neuron implementing integral control for its seven voltage-dependent conductances (fast sodium, gNa; slow Ca2+gCaS; transient Ca2+gCaT; A-type/transient potassium, gKA; Ca2+-dependent potassium, gKCa; delayed-rectifier potassium, gKd; hyperpolarization-activated mixed-cation, gH). A total of 20 independent runs are shown with mean in bold; axes are log-log; timeis normalized to τg. (Top) Voltage traces for an example neuron at the stages indicated.
(B) Examples of steady-state behavior of the bursting pacemaker from six independent runs.
(C) Scatter plots of conductance distributions (bottom left) and intrinsic properties (top right) at steady state of the 20 neurons from the independent runs in (A). Intrinsic properties are as follows: intraburst spike frequency (freq), burst duty cycle (dut cyc), slow-wave amplitude (amp), spike height (spike), and burst period (per).

