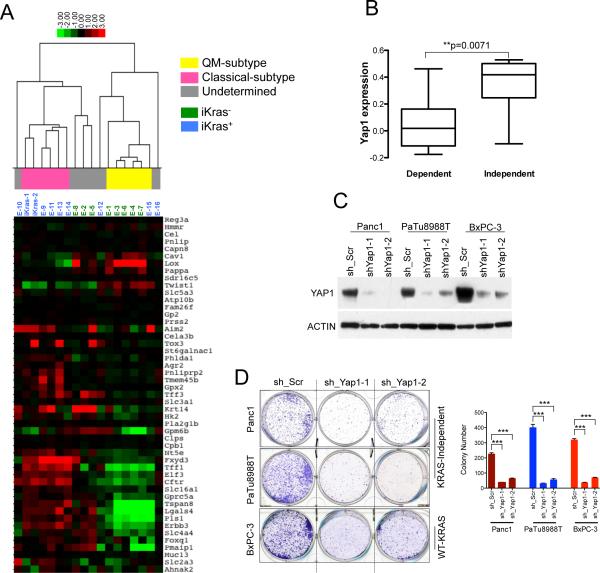
Figure 6. KrasG12D-independent relapse tumors resemble the quasimesenchymal-subtype of human PDAC.
(A) Hierarchical clustering of murine PDAC iKras cells and the relapse tumors into different PDAC subtypes using PDAssigner genes (Collisson et al., 2011). Subtype analysis found statistically significant association between iKras− relapse tumors and the QM subtype while the iKras+ tumors are associated with the classical subtype (Chi square test, p-value=0.01; Collisson et al., 2011). The subtype identity of the samples (in gray) is not apparent. (B) Gene expressiondata reanalyzed from Collisson et al., 2011 showing YAP1 expression is significantly higher in the Kras-independent lines compared to Kras-dependent human PDAC cells. The y-axis indicates gene expression data expressed as log2 median centered intensity. Boxed bars indicate the medians. (C) Western blots validating the knockdown of YAP1 in the indicated human PDAC cell lines by two independent shRNAs. (D) Representative wells (top) of clonogenic growth of Kras-independent QM human PDAC cells (Panc1 and PaTu8988T) and the Wild-type KRAS cell line BxPC-3 upon YAP1 knockdown. Quantification (bottom) from a representative experiment is shown on the right. Error bars represent SD of triplicate wells, ***p < 0.001.

