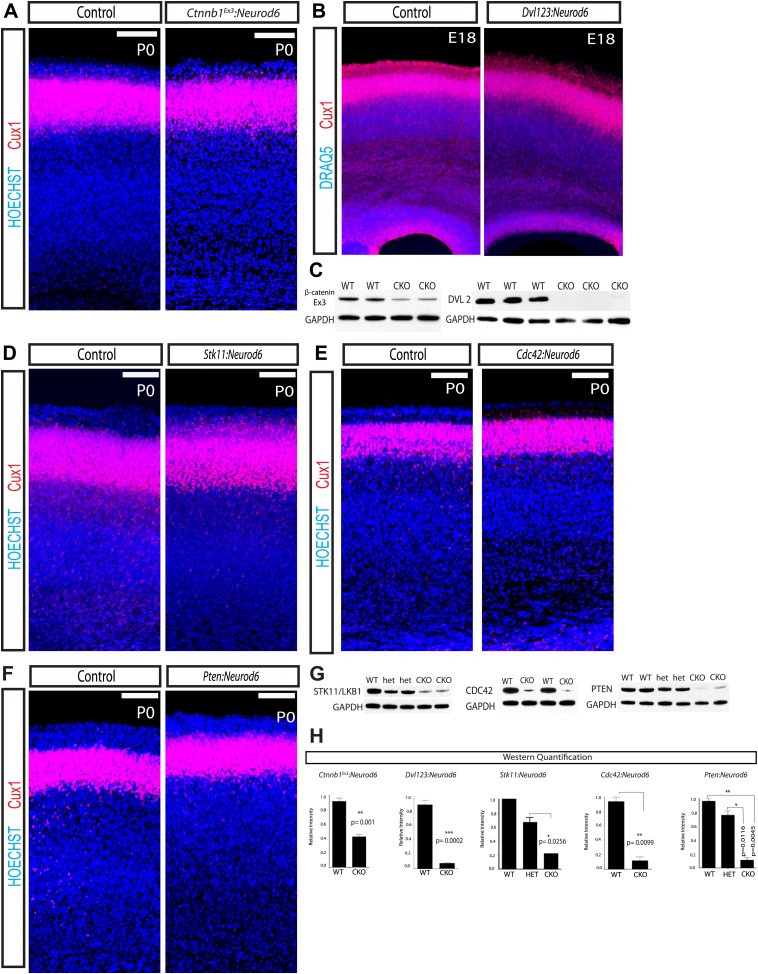
Figure 6. Lamination in other signaling mutants.
(A) P0 representative coronal sections of control (heterozygous for floxed allele) and Ctnnb1Ex3:Neurod6 mutants stained for Cux1 (red) and Hoechst (blue). (n = 5) Scale bar = 100 μm. (B) E18 Coronal sections of control and Dvl123:Neurod6 showing Cux-1 (red) and DRAQ5 (blue) staining. Cux-1 neurons reach layer 2/3 in both controls and Dvl123:Neurod6 triple mutants. (n = 3). (C) Western blot verification of protein deletion after recombination of floxed alleles with Neurod6-Cre. Ctnnb1Ex3:NeuroD6 (n = 3 WT, n = 3 CKO), Dvl123:NeuroD6 (n = 3 WT, n = 3 CKO). GAPDH was probed as a loading control. (D–F) P0 representative coronal sections of control (heterozygous for floxed allele) and indicated mutant lines stained for Cux1 and Hoechst. Scale bars are 100 μm, at least n = 5 per line. (G) Western blot verification of protein deletion in mutant lines. GAPDH was probed as a loading control. N's refer to numbers of mutants and paired controls. Stk11:Neurod6 (n = 2), Cdc42:Neurod6 (n = 2), Pten:Neurod6 (n = 3). (H) P0 Western Blot quantification of Ctnnb1Ex3:Neurod6, Dvl123:Neurod6, Stk11:Neurod6, Pten:Neurod6 and Cdc42:Neurod6 lines.


