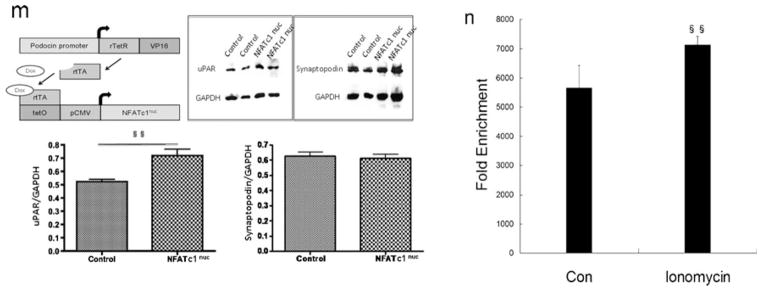
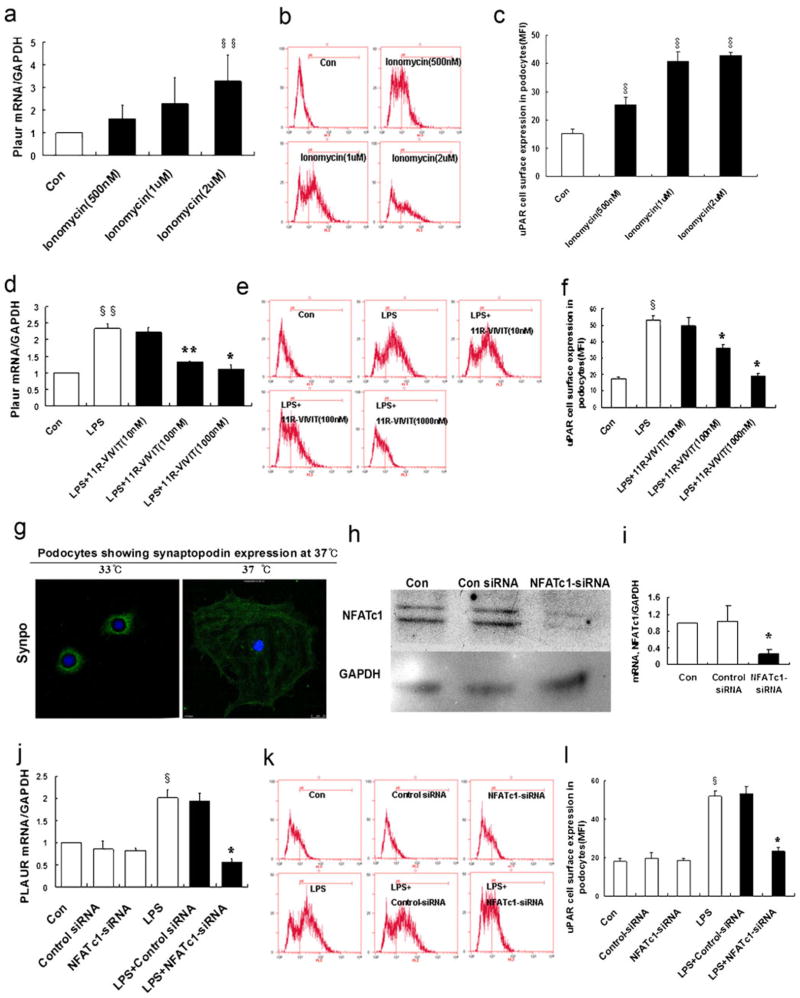
Fig. 5.

NFATc1 mediates the regulation of uPAR expression in podocytes. a Ionomycin activation of NFAT was used as a positive control. Ionomycin (0.5–2 μM) induced the expression of Plaur mRNA (encoding uPAR) in a dose-dependent manner (p<0.05). b, c Flow cytometry of uPAR expression showed an ionomycin-induced uPAR cell surface expression (p<0.01). d–f Same as ionomycin, LPS induced uPAR expression in podocytes. In contrast, 11R-VIVIT (NFAT inhibitor, 10–1,000 nM) inhibited the LPS-induced expression of Plaur mRNA (encoding uPAR (d); p<0.05 and p<0.01, respectively) and uPAR protein (e, f) (p<0.01) in a dose-dependent manner. NFATc1 was silenced using NFATc1-siRNA. Differentiated podocytes were identified by synaptopodin, a marker of this cell type (g). h, i Western blotting and quantitative real-time RT-PCR analysis showed that NFATc1-siRNA inhibited the expression of the NFATc1 protein (h) and mRNA (i) (p<0.01). j–l NFATc1-siRNA-treated podocytes showed a substantial reduction of Plaur mRNA (encoding uPAR (j); p<0.01) and uPAR protein (k, l) (p<0.01). m Schematic of constructs used for the generation of podocyte-specific, Dox-inducible NFATc1-nuc-transgenic mice. rTetR reverse Tet repressor, rtTA reverse tetracycline-controlled transactivator, VP16 herpes simplex VP16 protein, tetO tet operator sequences, pCMV cytomegalovirus promoter. Western blot analysis of isolated glomeruli from double-transgenic NFATc1nuc mice treated with Dox for 4 days revealed an increase in uPAR protein levels when compared to Dox-treated single transgenic rtTA mice used as the negative control. The protein levels of synaptopodin were not affected by NFATc1nuc transgene expression. The intensity of immunoblot signals was quantified by densitometry and the uPAR protein levels are depicted relative to the GAPDH levels in arbitrary units. n ChIP analysis in podocytes using antibody to NFATc1, followed by qPCR using the Plaur gene promoter-specific primer. The Amplified promoter sequence is designed at the region 455–572 bp upstream of TSS (chr7:25246946+25247063). Fold enrichment=[%(ChIP/Input)]/[%(Negative control/Input)]. All values are expressed as the means±SD. §p<0.01, §§p<0.05 versus control podocytes; *p<0.01, **p<0.05 versus LPS-treated podocytes

