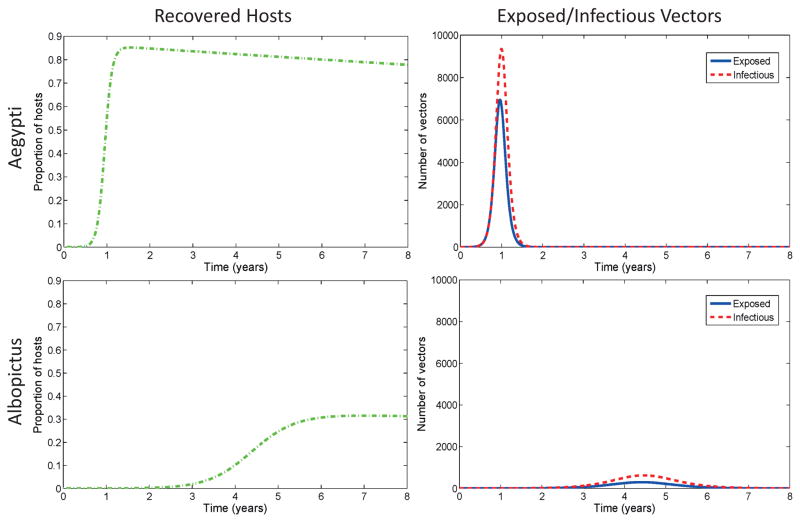
Figure 2.
Disease progression of dengue with A. albopictus and A. aegypti. The y-axis for the hosts is proportion of hosts (rather than number) and the x-axis is time in years. Columns are plotted on same scale. The timing and magnitude of the first epidemic differs between mosquito species. Notice that the model output for chikungunya (Figure 3) are quite different than the dengue plots, indicating different dynamics and relative risk for the two pathogens. The size and timing of the epidemic peak is driven by differences and tradeoffs between vector biting rates, the extrinsic incubation period, transmission probabilities (vector/host competence), and the infectious time for humans. Baseline parameters from Table 3 are used with initial conditions (Sh, Eh, Ih, Rh, Sv, Ev, Iv) = (H0 − 1, 0, 1, 0, Kv, 0, 0) where H0 = 100, 000 and Kv = 2H0.

