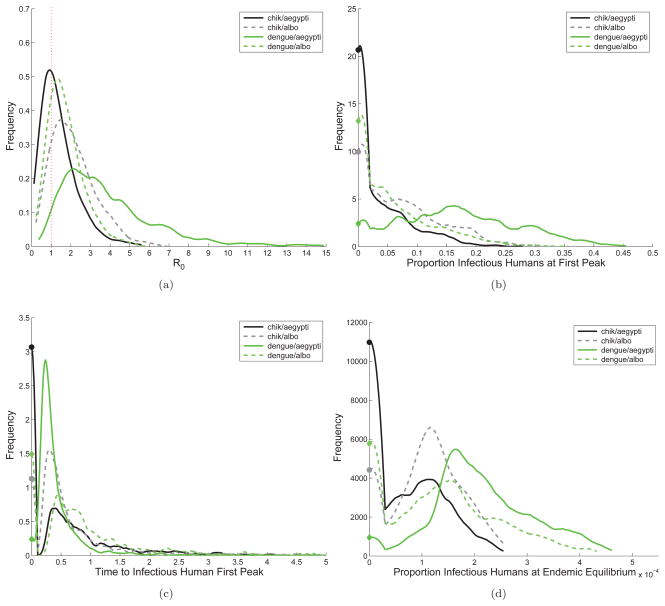
Figure 5.
Distributions for
 , first epidemic peak, and the endemic equilibrium, sampling uniformly from the ranges of the 8 most sensitive parameters (POIs). The x-axis is the value of the output variable being considered and the y-axis is the value of the associated probability distribution function (pdf). The vertical dashed red line at
 = 1 in subfigure (a) indicates the threshold value for an epidemic. For CHIK-A(A. aegypti) 64.5% of parameter combinations result in an outbreak with mathcal R0 > 1, while for CHIK-R(A. albopictus) 85.4%, for DENV(A. aegypti) 96.3%, and for DENV(A. albopictus) 79.8% do. Subfigures (b)–(d) show distributions for the magnitude of the first epidemic peak in humans, time to the first epidemic peak after introduction, and proportion of humans infectious at the endemic equilibrium. The far left side of the plots (b)– (d) (filled circles) are cases for which there is no epidemic (i.e.
 < 1). For subfigure (d), the x-axis units are in 10−4 and for (c) the x-axis units are in years. Notice that DENV(A. aegypti) and CHIK-R(A. albopictus) consistently have higher values for
 , a larger first epidemic peak, and move faster when first introduced. At the endemic equilibrium, however, the proportion of humans infectious at any given time is higher in general for systems with A. aegypti, even while accounting for virus strain. This indicates that the first epidemic depends strongly on the virus-vector-host interactions, but once endemic, vector characteristics are more important.

