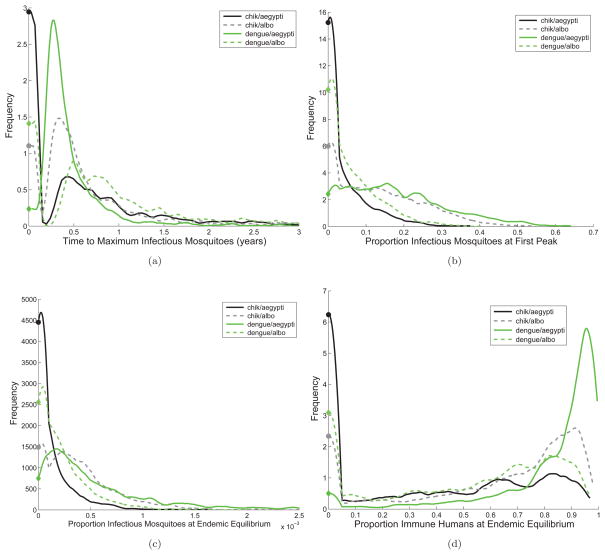
Figure B.6.
Subfigures (a) – (b) are distributions for the time to the first epidemic peak and the magnitude of the first peak in mosquitoes. Subfigures (b) – (c) are the proportion of infectious mosquitoes at the endemic equilibrium and proportion of recovered and immune humans at the endemic equilibrium. The x-axis is the value of the variable being considered and the y-axis is the value of the associated probability distribution function. The far left of each plot represents scenarios for which the disease does not take off.

