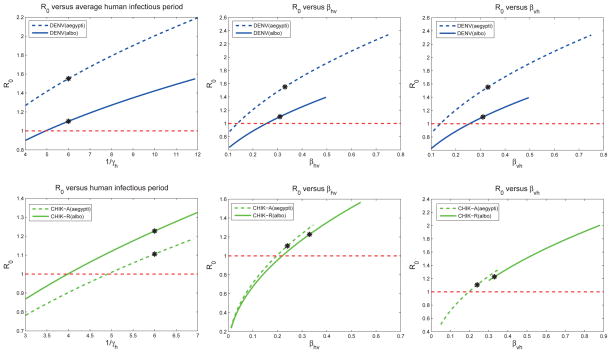
Figure B.7.
These plots show how the
 for dengue (top 3 plots) and chikungunya (bottom 3 plots) change as the parameters vary (one at a time) within the ranges given in Table 2, while all other parameters are set at baseline values. Baseline values for the models (indicated by a *) correspond to Table 6.

