Figure 3.

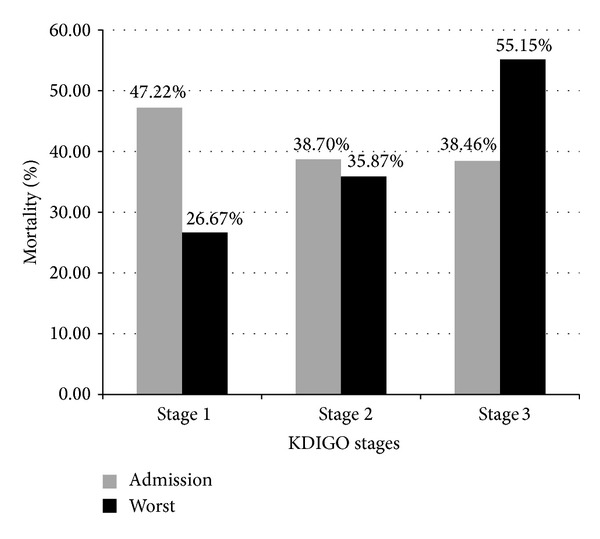
Mortality of septic AKI patients with different admission or the worst KDIGO stages. Gray bars represent mortality rates of patients grouped by admission KDIGO stages; black bars represent mortality rates of the worst KDIGO stages.

Mortality of septic AKI patients with different admission or the worst KDIGO stages. Gray bars represent mortality rates of patients grouped by admission KDIGO stages; black bars represent mortality rates of the worst KDIGO stages.