
Figure 1.
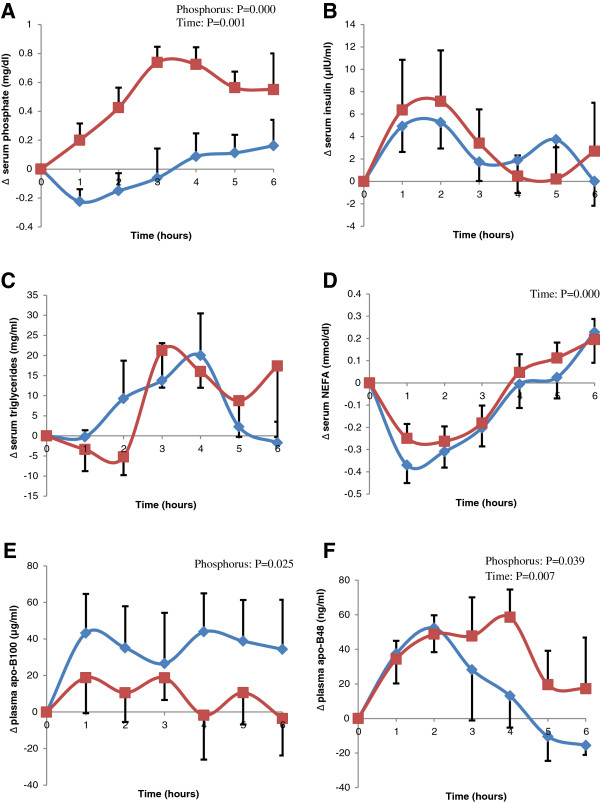
Difference from baseline (Δ) of postprandial: serum phosphate (A), insulin (B), triglycerides (C), NEFA (D), apoB100 (E), and plasma apo-B48 (F) after the ingestion of the high fat meal with placebo (diamond) or with 500 mg P (square). Two-factor repeated-measures analysis of variance (Phosphorus, Time and their Interaction, blue diamond; red square).