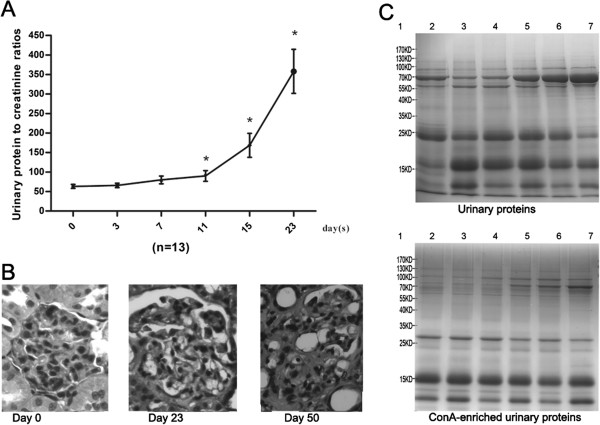
Figure 2.

Dynamic changes in ADR-treated rats. A) Urinary protein to creatinine ratios in six phases of ADR treated rats. The data are expressed as the mean ± standard deviation (n = 13, *p < 0.05 for Experiment vs. Control). The paired t test was used to assess the significance of the differences between groups. B) Histological changes in ADR-treated rats (HE staining, 400×). Compared with the normal condition, on day 23, glomerular lesions with mesangial matrix expansion could be detected; on day 50, glomerular sclerosis and severe interstitial expansion were found in many glomeruli. C) Urinary protein and ConA-enriched urinary protein pattern of one FSGS model rat. Lane 1: Marker. Lanes 2–7, urinary proteins and ConA-enriched urinary proteins at days 0, 3, 7, 11, 15 and 23 respectively.
