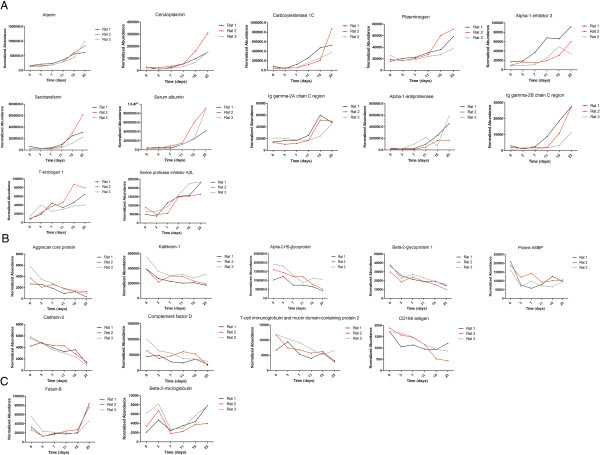
Figure 3.

Expression of candidate urine biomarkers of ADR-induced nephropathy during six stages. A) Twelve proteins shared an overall increasing trend in relative abundance. B) Nine proteins shared an overall decreasing trend. C) Two proteins changed at the early stage. The x axis represents different stages; the y axis represents the normalized abundance identified by the LC-MS Progenesis software.
